> ## Documentation Index
> Fetch the complete documentation index at: https://docs.tensor9.com/llms.txt
> Use this file to discover all available pages before exploring further.
# Configuring Observability
This guide covers configuring observability: setting up your sinks and routing, turning it on per appliance, and optionally instrumenting telemetry collection in your origin stack. For the conceptual model, including [telemetry routing](/fundamentals/observability#telemetry-routing), see [Observability](/fundamentals/observability).
## Configure your sinks and routing
Set up sinks and routing in the **Observe** section of the vendor portal (`tensor9 portal`).
### Add a sink
Click **Create an observability sink** and follow the three-step wizard. The configuration step differs by sink type:
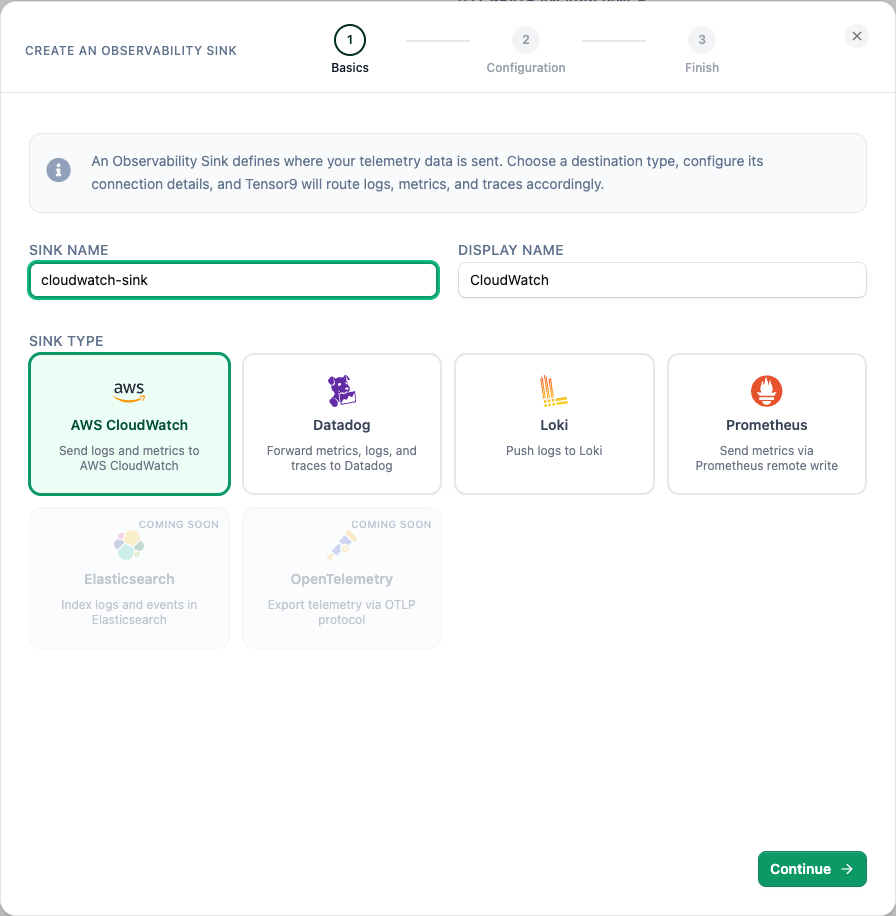
Give the sink a **name** and **display name**, then choose **AWS CloudWatch** as the type. Datadog, Loki, and Prometheus are also available; Elasticsearch and OpenTelemetry are coming soon.
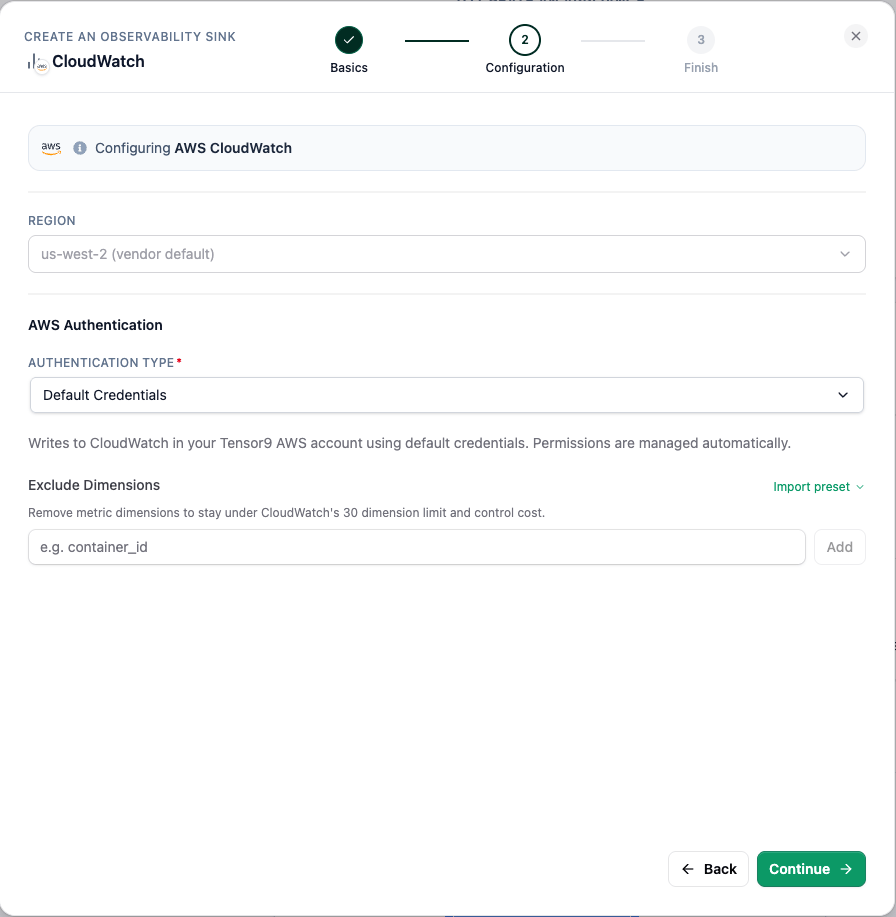
 Pick the **region** your logs, metrics, and traces are written to in CloudWatch (defaults to your vendor region) and the **authentication type**. **Default Credentials** writes to CloudWatch in your Tensor9 account with permissions managed automatically; you can also assume a cross-account role. Optionally add **Exclude Dimensions** to stay under CloudWatch's 30-dimension limit and control cost.
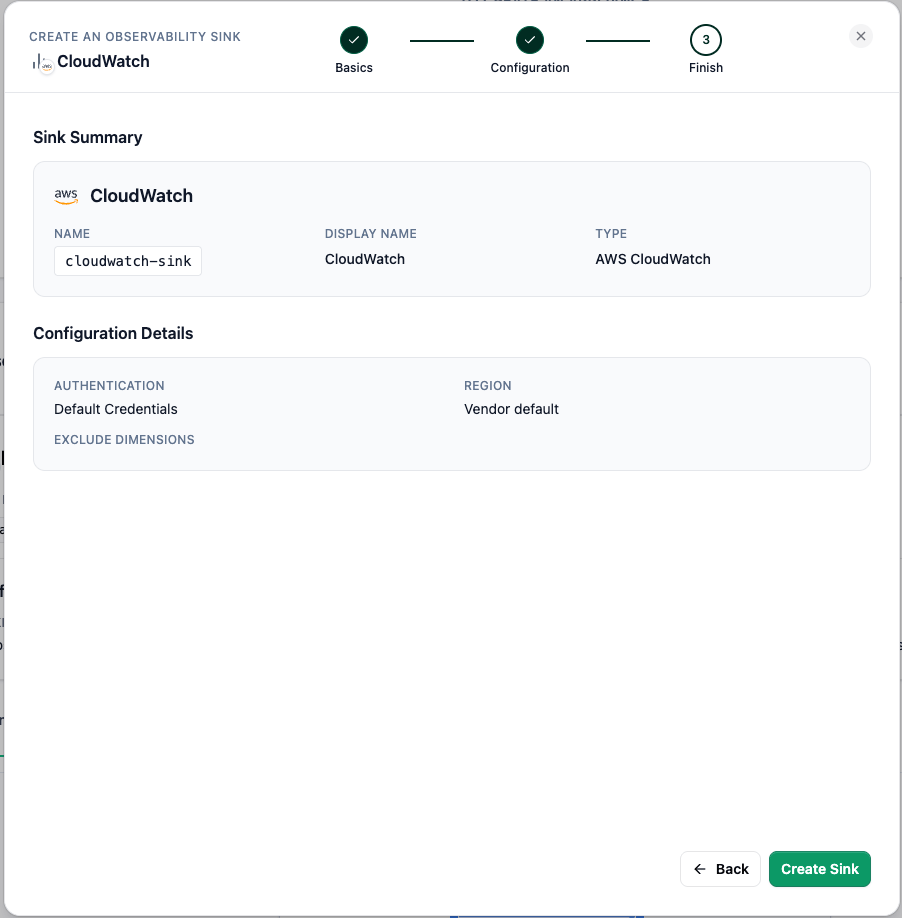
 Review the **sink summary** and select **Create Sink**.
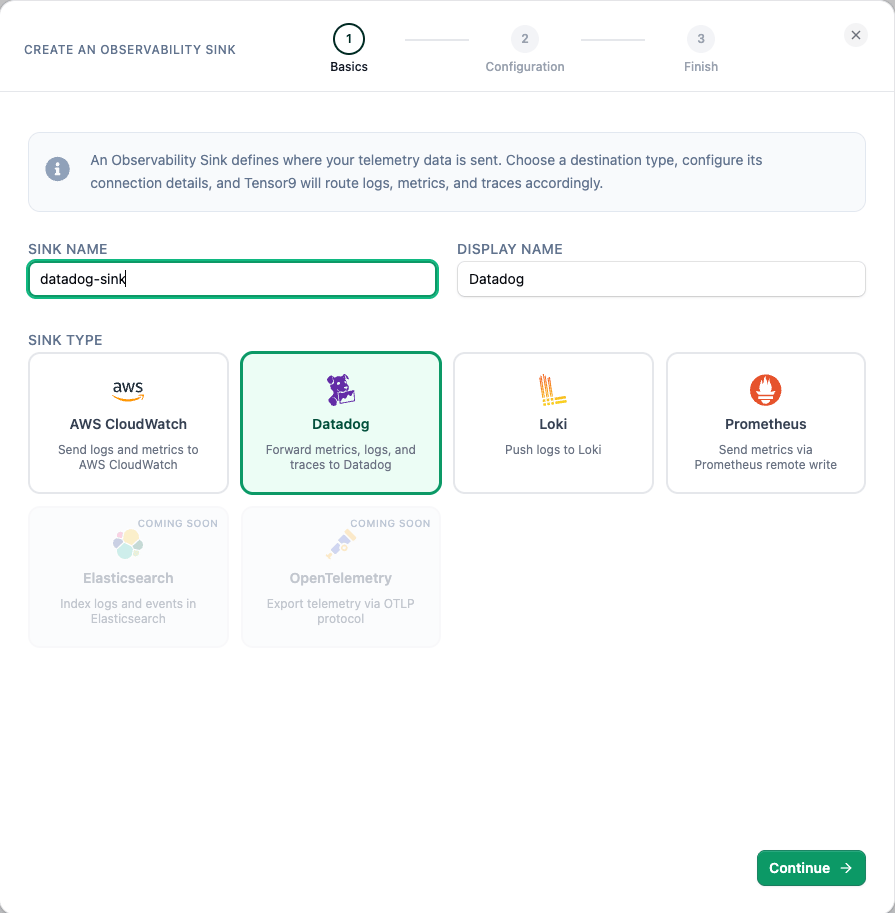
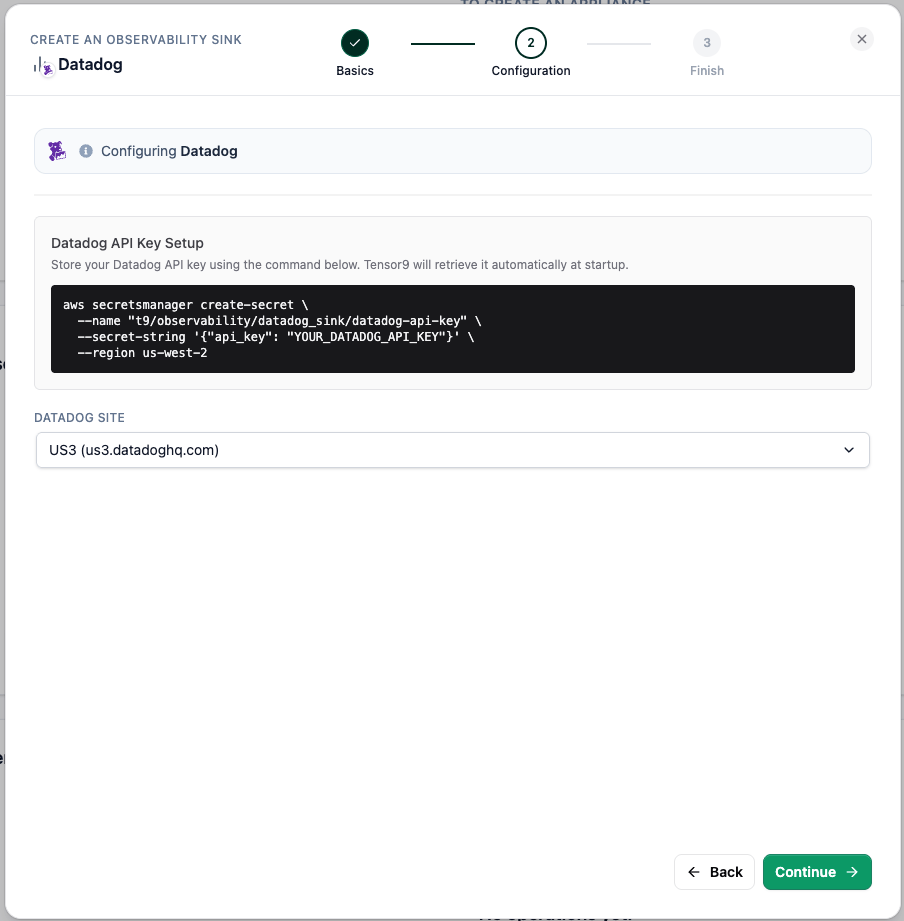
 Give the sink a **name** and **display name**, then choose **Datadog** as the type.
 **Store your Datadog API key** in your control plane's secret store with the `aws secretsmanager create-secret` command shown in the wizard. Tensor9 reads it at startup, so the key is never part of the sink config and is never deployed to an appliance. Then choose your **Datadog site**.
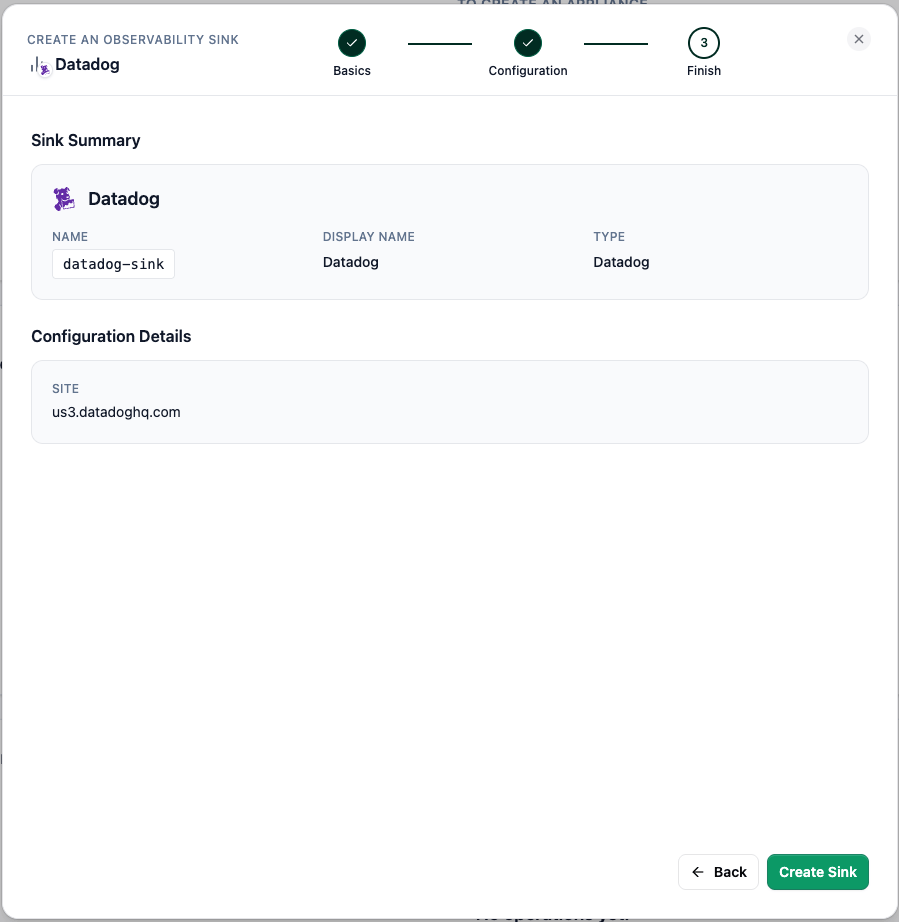
 Review the **sink summary** and select **Create Sink**.
 Sink credentials are stored encrypted in your control plane and are never deployed to customer appliances.
### Route your telemetry
In the **Observe** section your sinks are listed with the **Routing** view directly below them. It places your **sources on the left** and **sinks on the right**; drag a colored source handle to a sink to route that signal. Connections are color-coded by signal (logs, metrics, and traces), and you can only connect matching signals (a source's logs to a sink that accepts logs). By default each sink receives only its matching source.
Sink credentials are stored encrypted in your control plane and are never deployed to customer appliances.
### Route your telemetry
In the **Observe** section your sinks are listed with the **Routing** view directly below them. It places your **sources on the left** and **sinks on the right**; drag a colored source handle to a sink to route that signal. Connections are color-coded by signal (logs, metrics, and traces), and you can only connect matching signals (a source's logs to a sink that accepts logs). By default each sink receives only its matching source.
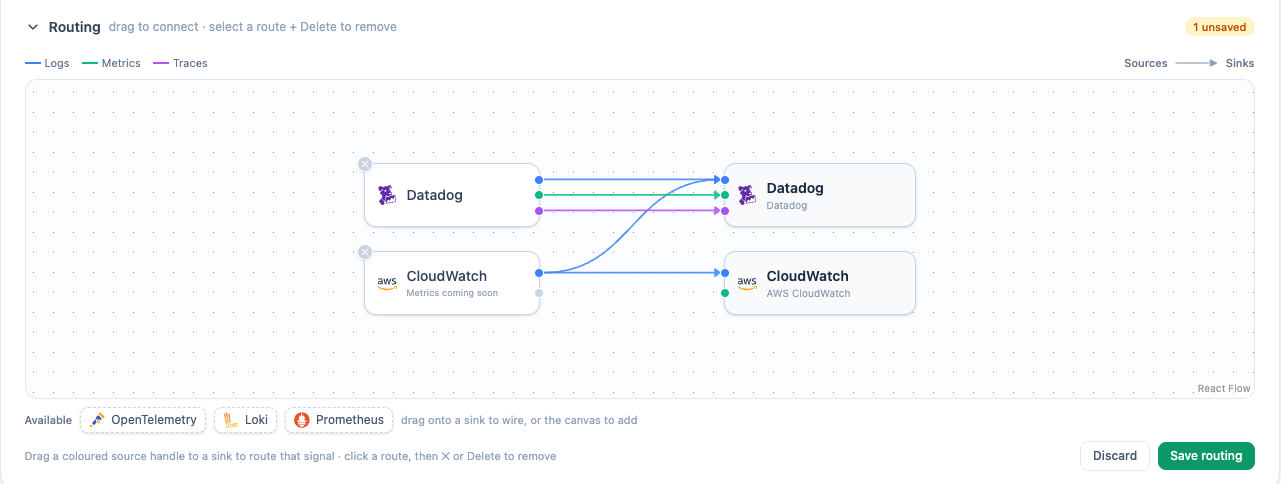
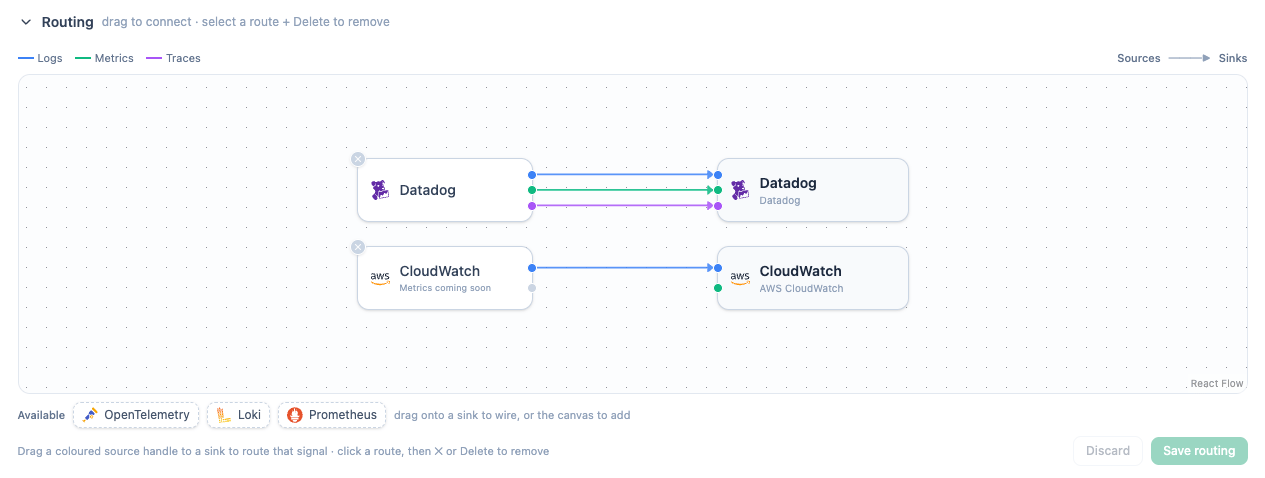 To change routing, drag a new connection or select one and remove it. Changes are staged; review the unsaved-changes badge, then select **Save routing**.
 ## Turn observability on or off
You control observability at two levels: the whole appliance and individual resources within it. Both are managed in the vendor portal, on the appliance's detail page, and both are **orthogonal to [routing](/fundamentals/observability#telemetry-routing)**: these toggles decide *whether* something is observed, while routing decides *which sinks receive which sources* once it is.
### Per appliance
Observability is turned on or off for an **entire appliance** with a single switch on the appliance's detail page. This is the master control, and it's **off by default** (observability is opt-in per appliance):
* **Off:** nothing is collected from the appliance; no telemetry reaches any sink.
* **On:** Tensor9 stands up the collection pipeline for that appliance, and its resources begin reporting (subject to the per-resource toggles below).
### Per resource
Once an appliance has observability on, you can turn collection on or off for each **resource** independently (a Lambda function, an ECS service, and so on), each listed with its name and stack alongside a switch. Use this to collect from the resources you care about and leave noisy or high-volume ones off.
* **On:** Tensor9 sets up collection for that resource, and its telemetry flows to your sinks (per your routing).
* **Off:** collection is removed for that resource, and nothing flows from it. The shared collection pipeline stays in place until the *last* observed resource is turned off, so toggling one resource never disrupts the others.
Changes settle in the background rather than instantly, so an appliance or resource briefly shows a **Pending** state while it transitions: filling when you turn it on (until telemetry actually flows) and draining when you turn it off. It clears on its own once the change takes effect.
## Configure telemetry in your origin stack
In your origin stack, you can configure telemetry collection however you like: define log groups, add instrumentation libraries, configure metrics exporters, or use any telemetry approach that works for your application. Tensor9 analyzes your origin stack during compilation and automatically configures the appropriate telemetry routing for each appliance based on your observability sink configuration.
Here are two common examples:
### Example 1: Send telemetry to CloudWatch in your control plane
Define resources with CloudWatch logging in your origin stack:
```terraform theme={null}
# Example: Lambda function with CloudWatch logs
resource "aws_lambda_function" "api" {
function_name = "myapp-api-${var.instance_id}"
handler = "index.handler"
runtime = "nodejs18.x"
}
resource "aws_cloudwatch_log_group" "api" {
name = "/aws/lambda/myapp-api-${var.instance_id}"
retention_in_days = 7
}
```
During compilation, Tensor9 detects the CloudWatch log group and automatically configures log forwarding from each appliance to CloudWatch in your Tensor9 AWS account (your control plane).
### Example 2: Send telemetry to Datadog via your control plane
Configure resources with Datadog instrumentation in your origin stack:
```terraform theme={null}
# Example: Lambda function with Datadog instrumentation
resource "aws_lambda_function" "api" {
function_name = "myapp-api-${var.instance_id}"
handler = "index.handler"
runtime = "nodejs18.x"
layers = [var.datadog_lambda_layer_arn]
environment {
variables = {
DD_API_KEY = var.datadog_api_key
DD_SITE = var.datadog_site
DD_TRACE_ENABLED = "true"
DD_SERVICE = "myapp-api"
DD_ENV = var.instance_id
}
}
}
```
During compilation, Tensor9 strips out the Datadog credentials from your origin stack so they are never deployed to customer appliances. Telemetry flows from each appliance back to your control plane without credentials, and your control plane then forwards the telemetry to your Datadog account using the credentials you configured for your Datadog sink.
These are just examples. You can configure telemetry collection in your origin stack using any approach, and Tensor9 will handle the deployment details appropriately for each appliance.
## Turn observability on or off
You control observability at two levels: the whole appliance and individual resources within it. Both are managed in the vendor portal, on the appliance's detail page, and both are **orthogonal to [routing](/fundamentals/observability#telemetry-routing)**: these toggles decide *whether* something is observed, while routing decides *which sinks receive which sources* once it is.
### Per appliance
Observability is turned on or off for an **entire appliance** with a single switch on the appliance's detail page. This is the master control, and it's **off by default** (observability is opt-in per appliance):
* **Off:** nothing is collected from the appliance; no telemetry reaches any sink.
* **On:** Tensor9 stands up the collection pipeline for that appliance, and its resources begin reporting (subject to the per-resource toggles below).
### Per resource
Once an appliance has observability on, you can turn collection on or off for each **resource** independently (a Lambda function, an ECS service, and so on), each listed with its name and stack alongside a switch. Use this to collect from the resources you care about and leave noisy or high-volume ones off.
* **On:** Tensor9 sets up collection for that resource, and its telemetry flows to your sinks (per your routing).
* **Off:** collection is removed for that resource, and nothing flows from it. The shared collection pipeline stays in place until the *last* observed resource is turned off, so toggling one resource never disrupts the others.
Changes settle in the background rather than instantly, so an appliance or resource briefly shows a **Pending** state while it transitions: filling when you turn it on (until telemetry actually flows) and draining when you turn it off. It clears on its own once the change takes effect.
## Configure telemetry in your origin stack
In your origin stack, you can configure telemetry collection however you like: define log groups, add instrumentation libraries, configure metrics exporters, or use any telemetry approach that works for your application. Tensor9 analyzes your origin stack during compilation and automatically configures the appropriate telemetry routing for each appliance based on your observability sink configuration.
Here are two common examples:
### Example 1: Send telemetry to CloudWatch in your control plane
Define resources with CloudWatch logging in your origin stack:
```terraform theme={null}
# Example: Lambda function with CloudWatch logs
resource "aws_lambda_function" "api" {
function_name = "myapp-api-${var.instance_id}"
handler = "index.handler"
runtime = "nodejs18.x"
}
resource "aws_cloudwatch_log_group" "api" {
name = "/aws/lambda/myapp-api-${var.instance_id}"
retention_in_days = 7
}
```
During compilation, Tensor9 detects the CloudWatch log group and automatically configures log forwarding from each appliance to CloudWatch in your Tensor9 AWS account (your control plane).
### Example 2: Send telemetry to Datadog via your control plane
Configure resources with Datadog instrumentation in your origin stack:
```terraform theme={null}
# Example: Lambda function with Datadog instrumentation
resource "aws_lambda_function" "api" {
function_name = "myapp-api-${var.instance_id}"
handler = "index.handler"
runtime = "nodejs18.x"
layers = [var.datadog_lambda_layer_arn]
environment {
variables = {
DD_API_KEY = var.datadog_api_key
DD_SITE = var.datadog_site
DD_TRACE_ENABLED = "true"
DD_SERVICE = "myapp-api"
DD_ENV = var.instance_id
}
}
}
```
During compilation, Tensor9 strips out the Datadog credentials from your origin stack so they are never deployed to customer appliances. Telemetry flows from each appliance back to your control plane without credentials, and your control plane then forwards the telemetry to your Datadog account using the credentials you configured for your Datadog sink.
These are just examples. You can configure telemetry collection in your origin stack using any approach, and Tensor9 will handle the deployment details appropriately for each appliance.