> ## Documentation Index
> Fetch the complete documentation index at: https://docs.tensor9.com/llms.txt
> Use this file to discover all available pages before exploring further.
# Your Control Plane
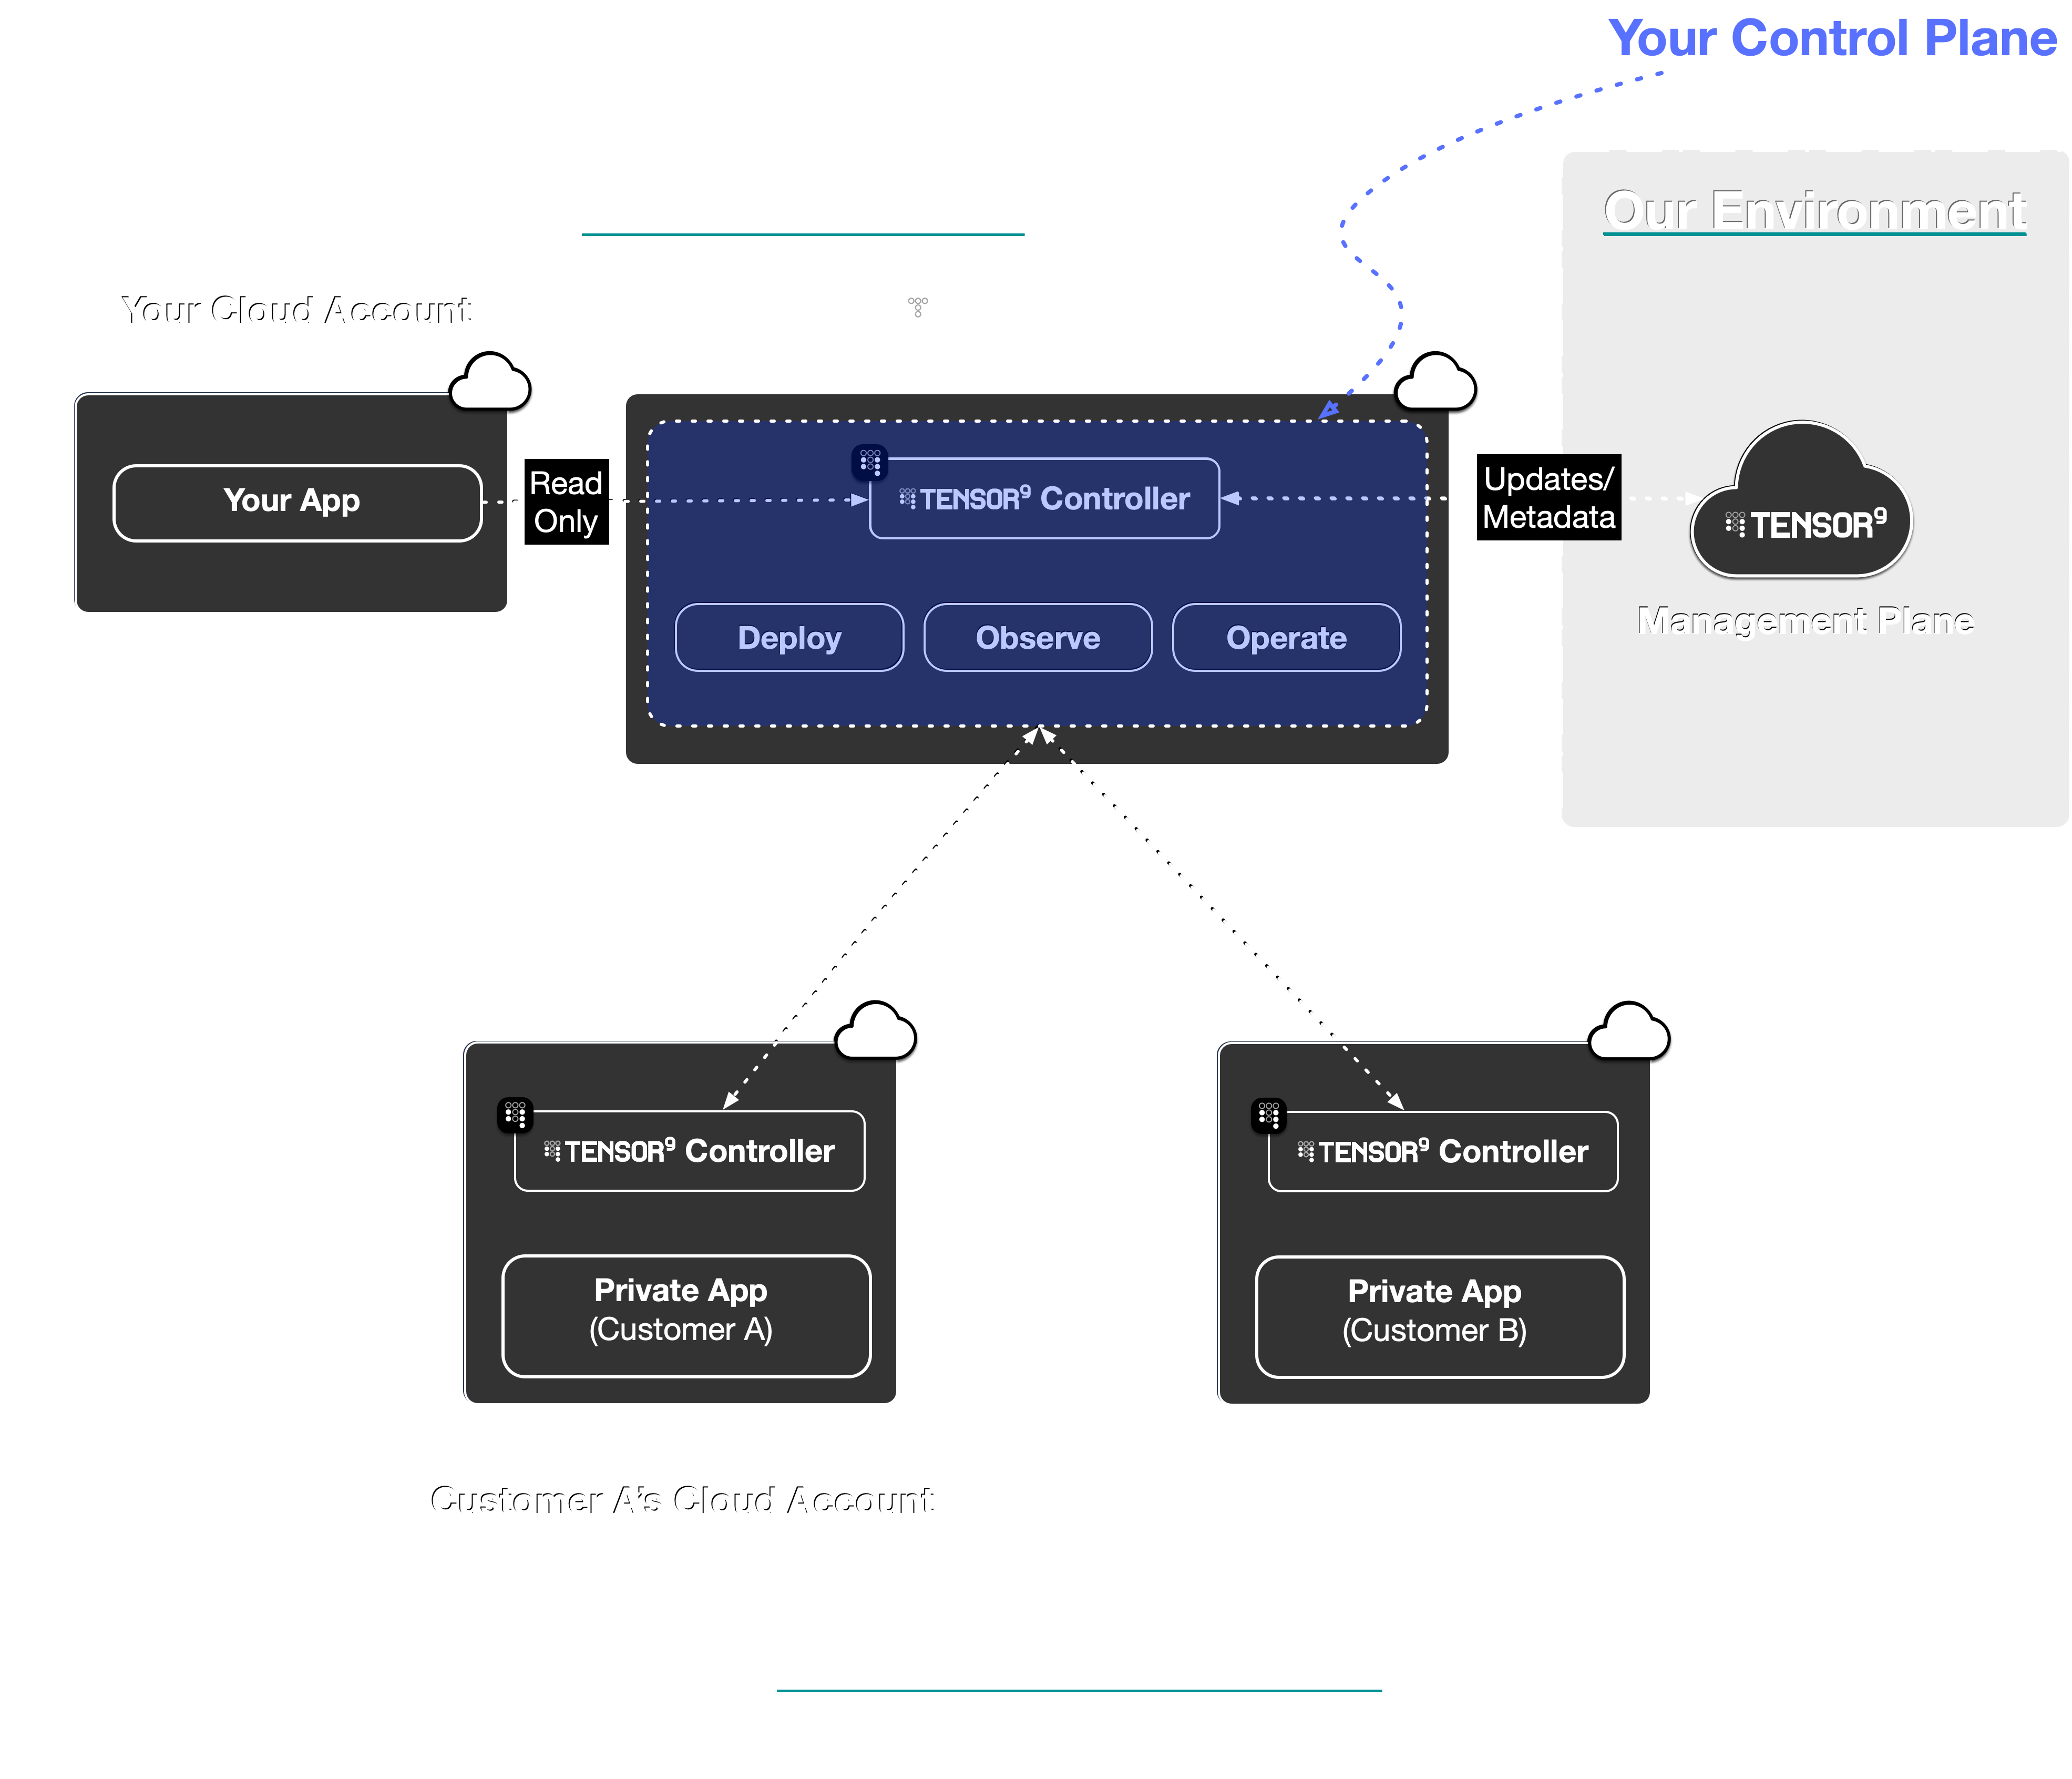
Your Tensor9 **control plane** is the central nervous system of your private software distribution platform. It is **provisioned directly within your own dedicated AWS account** for Tensor9. This architecture ensures that your intellectual property, customer data, and infrastructure credentials always remain under your ownership and control.
Your control plane is responsible for orchestrating the entire lifecycle of your applications, from compiling your origin stack into a deployable artifact, to enabling your to manage ongoing operations and observability for every customer appliance.
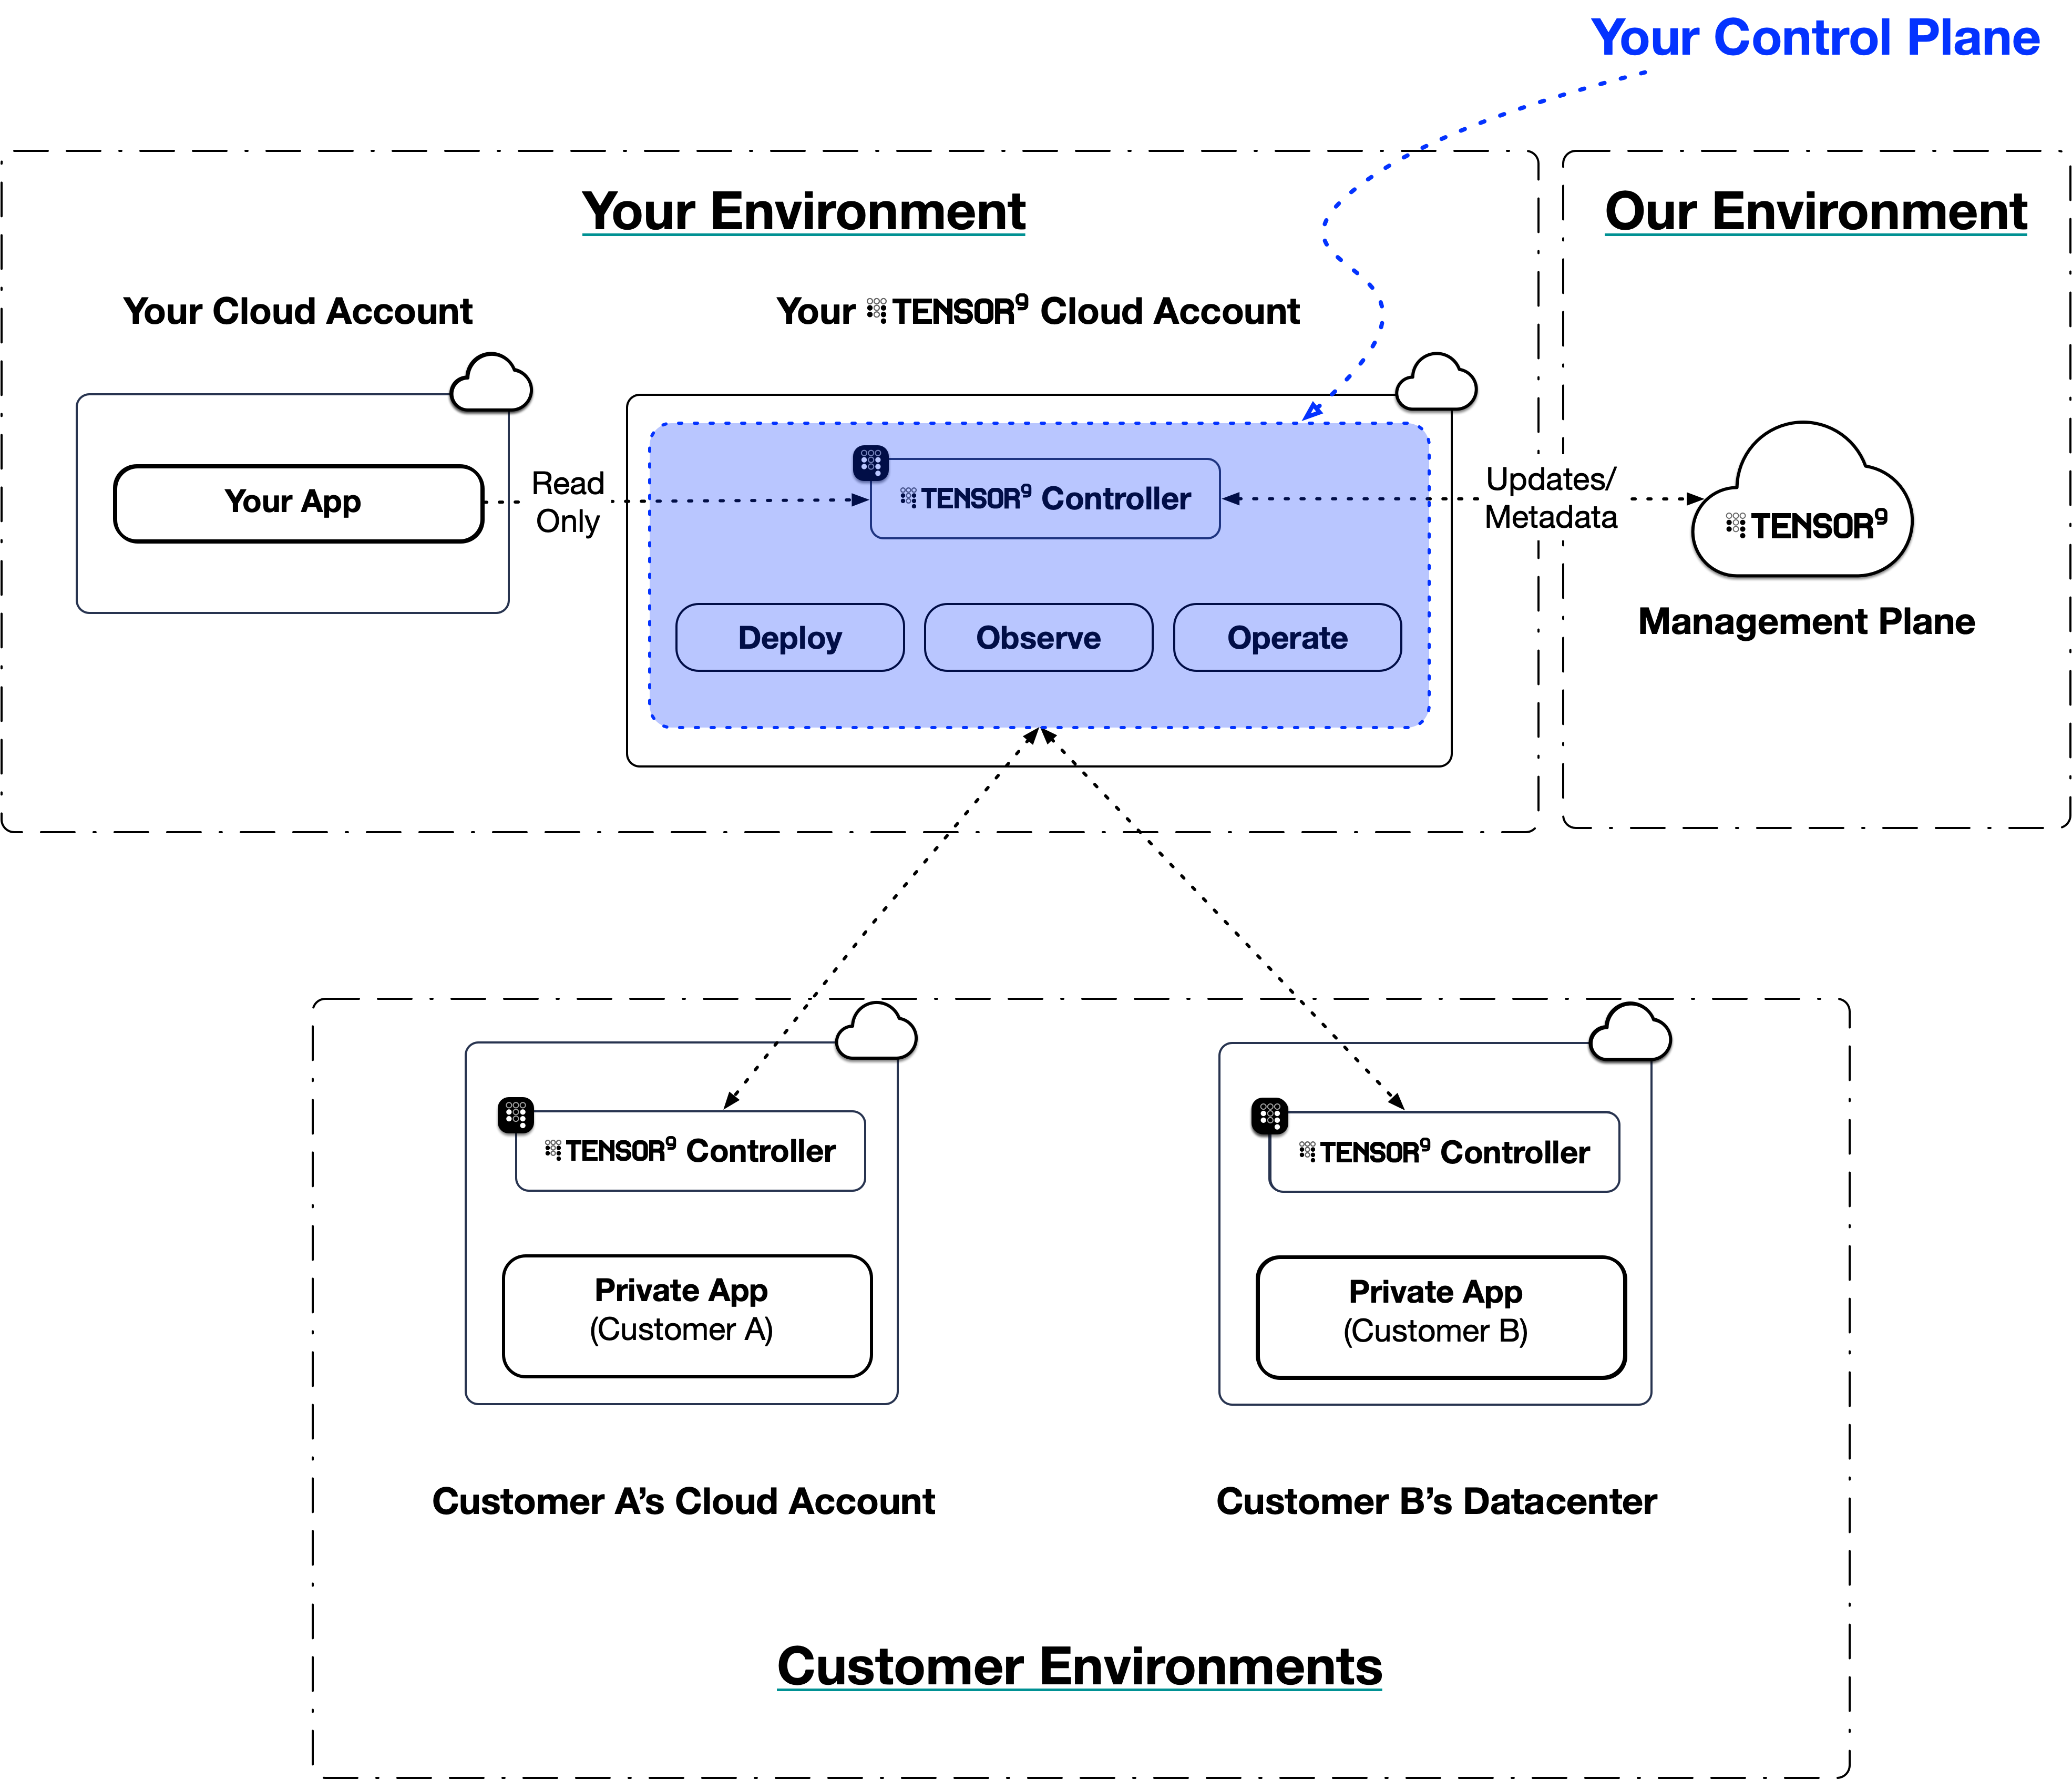
 ## How it works
Once [installed](/fundamentals/install), your control plane acts as the central authority for managing your software distribution. It runs within your cloud account, using read-only IAM roles to interact with your origin stack's infrastructure-as-code, artifacts, and secrets. You interact with your control plane through two interfaces: the **`tensor9` CLI** and the **[Vendor Portal](/fundamentals/key-concepts#vendor-portal)**, a web dashboard for monitoring and managing your apps, appliances, and operations. Deployments are handled through the CLI and your CI/CD pipeline.
Its responsibilities are divided into three main areas: **deployments**, **observability**, and **operations**.
### Deployments: From origin stack to appliance
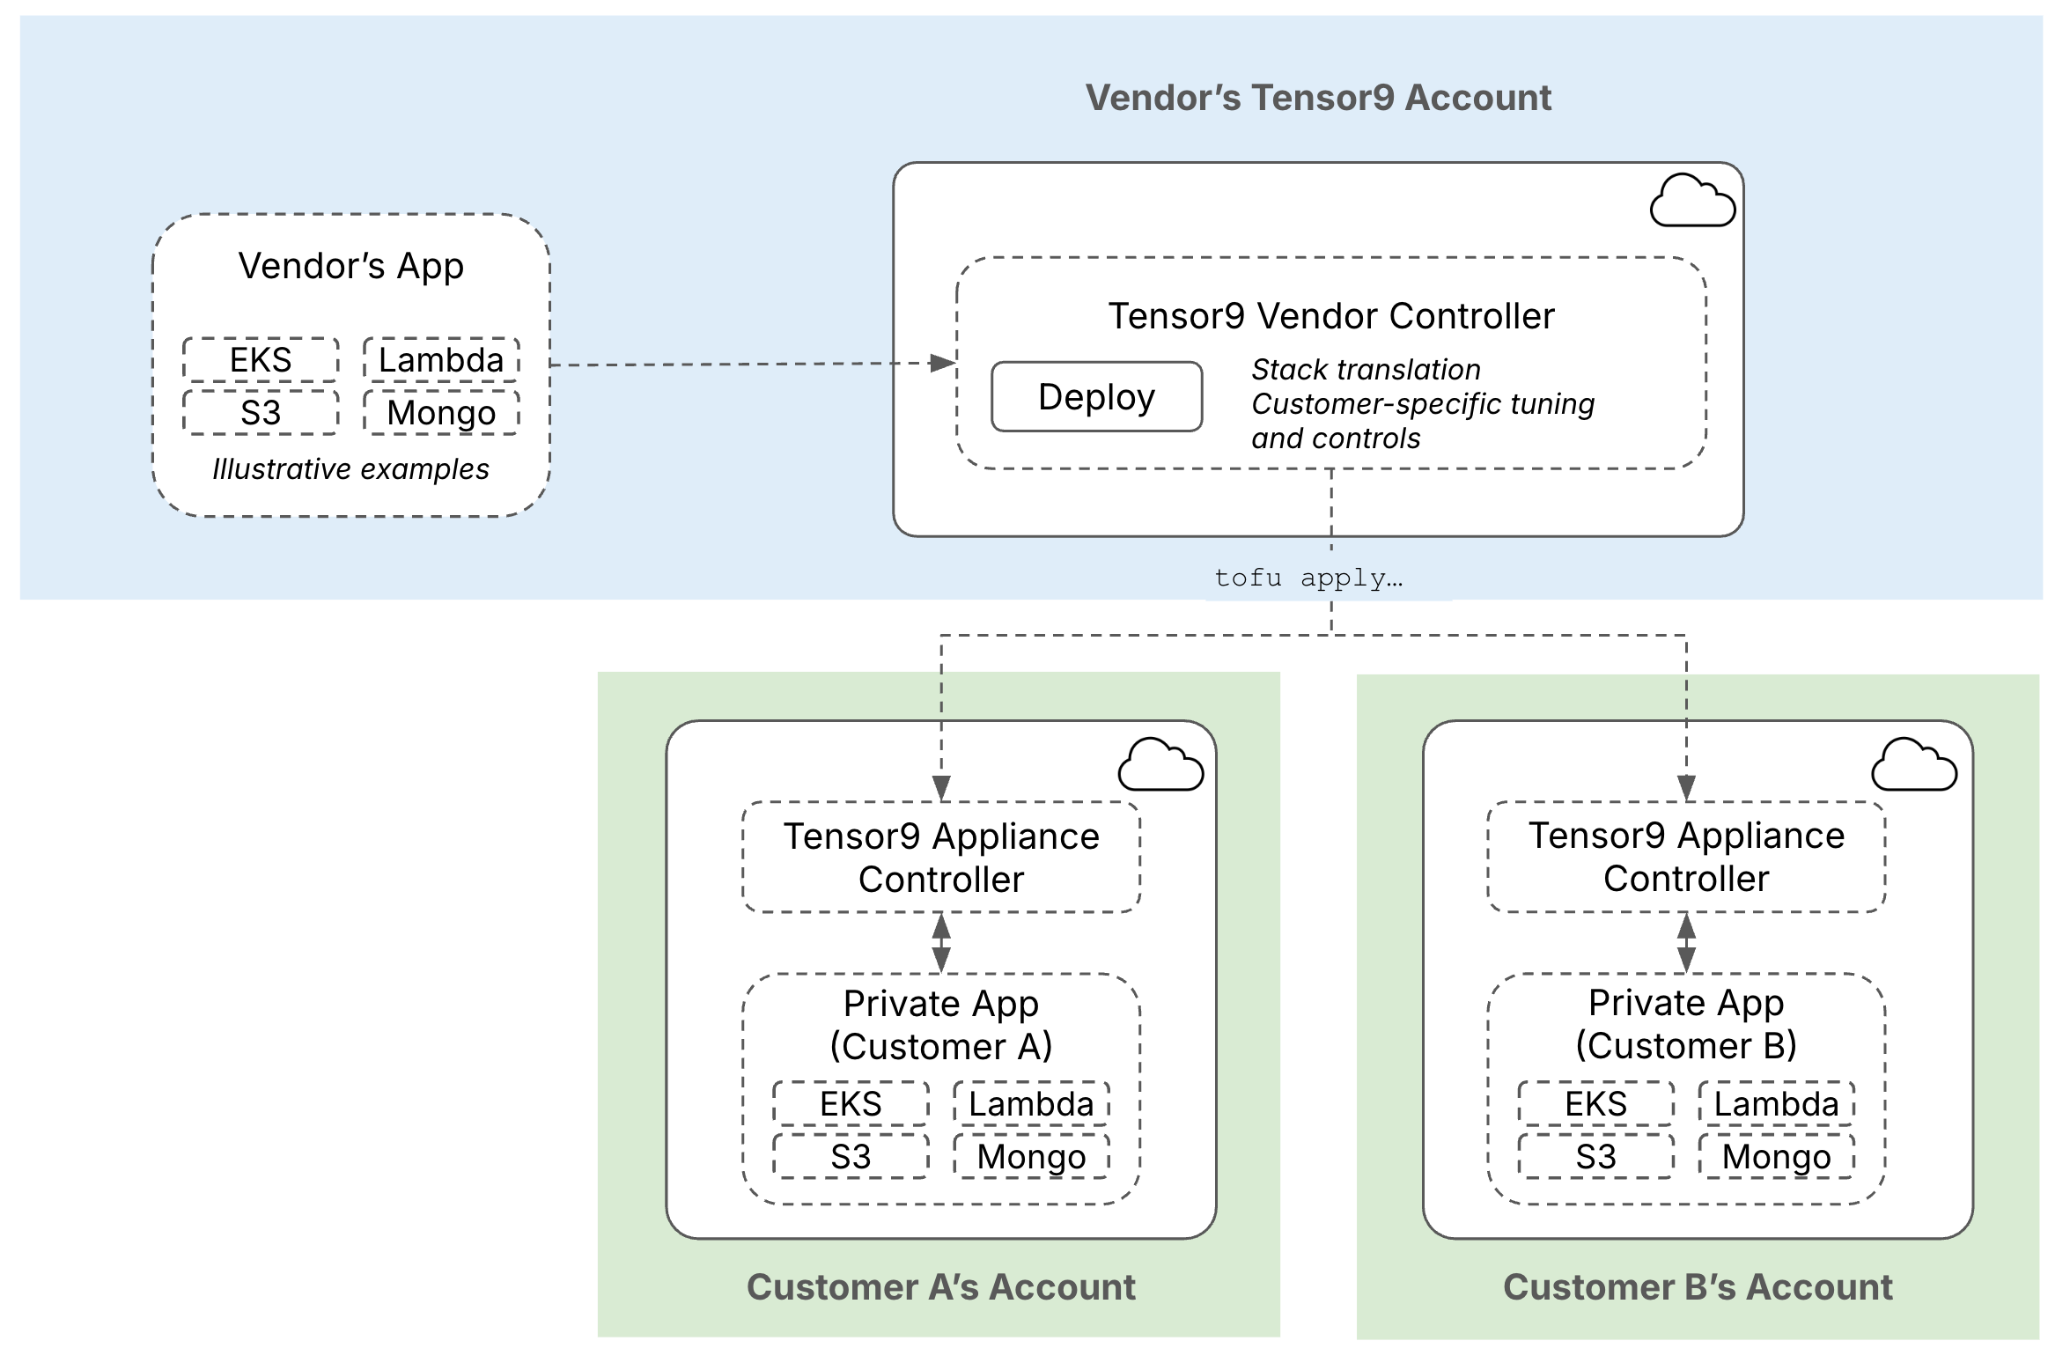
Your control plane automates the process of compiling your app into customer-specific **[appliances](/fundamentals/appliances)**. This process begins with your **[origin stack](/fundamentals/origin-stacks)**.
An origin stack is the blueprint for your application - it can be a Terraform workspace, a Docker image, or a CloudFormation template. When you publish a new version of your origin stack and create a **release**, your control plane "compiles" it into a **deployment stack**. This compilation step involves:
1. **Validation**: Your control plane inspects the origin stack to ensure it's well-formed and meets Tensor9 requirements.
2. **Porting**: It translates cloud-specific resources in your origin stack to their equivalents in the target customer's environment, based on the appliance's **[form factor](/fundamentals/key-concepts#form-factor)**. For example, if your origin stack uses AWS RDS for its database, but the customer's appliance is set to run on Google Cloud, your control plane will replace RDS with Cloud SQL during compilation.
3. **Observability**: It prepares the stack to be observed when deployed within an appliance by configuring the routing for logs, metrics, and traces.
4. **Packaging**: The result of this compilation process is a **deployment stack**. This is a self-contained, deployable infrastructure-as-code artifact you deploy in your own environment (e.g. `terraform apply` or `tofu apply`) that deploys your application into a specific customer's appliance.
## How it works
Once [installed](/fundamentals/install), your control plane acts as the central authority for managing your software distribution. It runs within your cloud account, using read-only IAM roles to interact with your origin stack's infrastructure-as-code, artifacts, and secrets. You interact with your control plane through two interfaces: the **`tensor9` CLI** and the **[Vendor Portal](/fundamentals/key-concepts#vendor-portal)**, a web dashboard for monitoring and managing your apps, appliances, and operations. Deployments are handled through the CLI and your CI/CD pipeline.
Its responsibilities are divided into three main areas: **deployments**, **observability**, and **operations**.
### Deployments: From origin stack to appliance
Your control plane automates the process of compiling your app into customer-specific **[appliances](/fundamentals/appliances)**. This process begins with your **[origin stack](/fundamentals/origin-stacks)**.
An origin stack is the blueprint for your application - it can be a Terraform workspace, a Docker image, or a CloudFormation template. When you publish a new version of your origin stack and create a **release**, your control plane "compiles" it into a **deployment stack**. This compilation step involves:
1. **Validation**: Your control plane inspects the origin stack to ensure it's well-formed and meets Tensor9 requirements.
2. **Porting**: It translates cloud-specific resources in your origin stack to their equivalents in the target customer's environment, based on the appliance's **[form factor](/fundamentals/key-concepts#form-factor)**. For example, if your origin stack uses AWS RDS for its database, but the customer's appliance is set to run on Google Cloud, your control plane will replace RDS with Cloud SQL during compilation.
3. **Observability**: It prepares the stack to be observed when deployed within an appliance by configuring the routing for logs, metrics, and traces.
4. **Packaging**: The result of this compilation process is a **deployment stack**. This is a self-contained, deployable infrastructure-as-code artifact you deploy in your own environment (e.g. `terraform apply` or `tofu apply`) that deploys your application into a specific customer's appliance.
 ### Observability: centralized logs, metrics, and traces
Your control plane handles **[observability](/fundamentals/observability)** for all deployed appliances by ensuring the instrumentation your application already has continues to function. Tensor9 does not add new agents or require code changes; instead, it configures the routing needed for the telemetry your application is already configured to produce.
The appliance runtime captures the telemetry data that your software and its underlying infrastructure generates, including:
* **Logs**: App logs that your software writes to standard output.
* **Metrics**: Custom metrics your software produces, and system metrics your infrastructure produces (e.g. k8s node CPU utilization, storage bucket size).
* **Traces**: Distributed traces your software produces.
This telemetry is streamed from each appliance to a secure endpoint within your control plane. Your control plane then acts as a central aggregator, routing each telemetry stream to the observability sinks you've configured (such as Datadog, CloudWatch, or an OpenTelemetry collector), with control over which sources feed which sinks. This provides a centralized way to view data from all appliances.
#### Integrating with existing observability
Tensor9 works with your existing observability setup. It configures the appliance environment so that your application's existing telemetry is sent to its original destination.
For example, consider an origin stack defined in Terraform. Tensor9 automatically injects a unique `instance_id` variable into your configuration for each appliance.
```terraform theme={null}
variable "instance_id" {
type = string
description = "Uniquely identifies the instance to deploy into (e.g. saas, customer-1, customer-2)"
}
resource "aws_lambda_function" "my_lambda" {
function_name = "my-function"
handler = "index.handler"
runtime = "nodejs18.x"
# ... other lambda configuration ...
}
resource "aws_cloudwatch_log_group" "lambda_lg" {
name = "/aws/lambda/${aws_lambda_function.my_lambda.function_name}/${var.instance_id}"
retention_in_days = 14
}
```
By using the `instance_id` variable in the log group name, you ensure that each appliance creates a distinct log group. When an appliance is deployed, the logs from `my-function` will be sent to a unique log group `/aws/lambda/my-function/appliance-xyz-123`. This allows you to observe each customer environment in isolation while using the same origin stack for all deployments. Your existing dashboards and analysis tools can then be configured to monitor these per-appliance log groups.
### Observability: centralized logs, metrics, and traces
Your control plane handles **[observability](/fundamentals/observability)** for all deployed appliances by ensuring the instrumentation your application already has continues to function. Tensor9 does not add new agents or require code changes; instead, it configures the routing needed for the telemetry your application is already configured to produce.
The appliance runtime captures the telemetry data that your software and its underlying infrastructure generates, including:
* **Logs**: App logs that your software writes to standard output.
* **Metrics**: Custom metrics your software produces, and system metrics your infrastructure produces (e.g. k8s node CPU utilization, storage bucket size).
* **Traces**: Distributed traces your software produces.
This telemetry is streamed from each appliance to a secure endpoint within your control plane. Your control plane then acts as a central aggregator, routing each telemetry stream to the observability sinks you've configured (such as Datadog, CloudWatch, or an OpenTelemetry collector), with control over which sources feed which sinks. This provides a centralized way to view data from all appliances.
#### Integrating with existing observability
Tensor9 works with your existing observability setup. It configures the appliance environment so that your application's existing telemetry is sent to its original destination.
For example, consider an origin stack defined in Terraform. Tensor9 automatically injects a unique `instance_id` variable into your configuration for each appliance.
```terraform theme={null}
variable "instance_id" {
type = string
description = "Uniquely identifies the instance to deploy into (e.g. saas, customer-1, customer-2)"
}
resource "aws_lambda_function" "my_lambda" {
function_name = "my-function"
handler = "index.handler"
runtime = "nodejs18.x"
# ... other lambda configuration ...
}
resource "aws_cloudwatch_log_group" "lambda_lg" {
name = "/aws/lambda/${aws_lambda_function.my_lambda.function_name}/${var.instance_id}"
retention_in_days = 14
}
```
By using the `instance_id` variable in the log group name, you ensure that each appliance creates a distinct log group. When an appliance is deployed, the logs from `my-function` will be sent to a unique log group `/aws/lambda/my-function/appliance-xyz-123`. This allows you to observe each customer environment in isolation while using the same origin stack for all deployments. Your existing dashboards and analysis tools can then be configured to monitor these per-appliance log groups.

 ### Operations: secure remote management
Your control plane provides **[operational endpoints](/fundamentals/operations)** that allow you to perform day-2 operations on your appliances. This provides an auditable method for remote management.
When an appliance is created, it establishes a secure, outbound-only tunnel to your control plane. The tunnel is mutual-TLS authenticated and is established over the public internet by default; [AWS PrivateLink](/customer/security/security-model#no-inbound-network-access) (for AWS-to-AWS deployments) and a vendor-provided Tailscale tailnet are optionally available as alternative network paths. See [Connectivity](/fundamentals/connectivity#appliance-to-control-plane) for a side-by-side comparison of network paths, and [Connection Security](/fundamentals/connection-security) for the mTLS trust model.
This tunnel allows you to use the `tensor9` CLI to:
* **Access a remote shell** inside an appliance for debugging.
* **Run specific, one-off commands** or scripts (e.g., database migrations, data backfills).
* **Securely manage secrets** and environment variables for a specific appliance.
* **Restart services** or trigger other state changes.
Every action taken through these operational endpoints is authenticated via your control plane's permissions model and is fully logged, providing an audit trail of who did what, and when. This allows you to manage appliances remotely while maintaining security and compliance.
### Operations: secure remote management
Your control plane provides **[operational endpoints](/fundamentals/operations)** that allow you to perform day-2 operations on your appliances. This provides an auditable method for remote management.
When an appliance is created, it establishes a secure, outbound-only tunnel to your control plane. The tunnel is mutual-TLS authenticated and is established over the public internet by default; [AWS PrivateLink](/customer/security/security-model#no-inbound-network-access) (for AWS-to-AWS deployments) and a vendor-provided Tailscale tailnet are optionally available as alternative network paths. See [Connectivity](/fundamentals/connectivity#appliance-to-control-plane) for a side-by-side comparison of network paths, and [Connection Security](/fundamentals/connection-security) for the mTLS trust model.
This tunnel allows you to use the `tensor9` CLI to:
* **Access a remote shell** inside an appliance for debugging.
* **Run specific, one-off commands** or scripts (e.g., database migrations, data backfills).
* **Securely manage secrets** and environment variables for a specific appliance.
* **Restart services** or trigger other state changes.
Every action taken through these operational endpoints is authenticated via your control plane's permissions model and is fully logged, providing an audit trail of who did what, and when. This allows you to manage appliances remotely while maintaining security and compliance.

