

aws::1.0.0::iam, with backend choices shown together. Read how Tensor9 estimates service-adapter costs for price scope and capacity qualification, or return to additional services.
AWS IAM and STS → Cedar
Origin API:aws::1.0.0::iam. Target backend: cedar::1.0.0::policy.
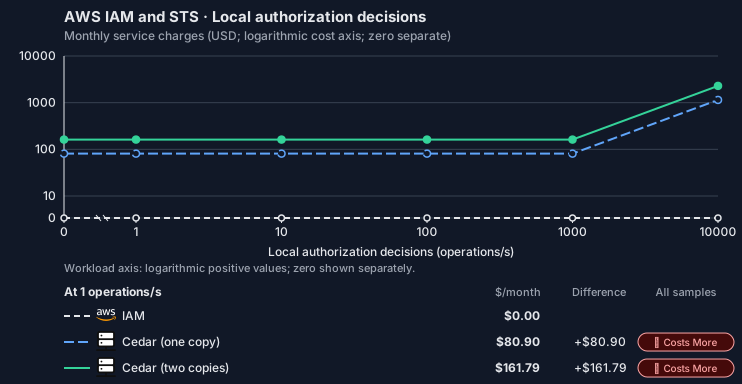
AWS IAM and STS · Local authorization decisions
Feature: AWS IAM and STS. Estimated monthly service charges by Local authorization decisions. Adapter hosting and Tensor9 fees are excluded. Source: us-east-1; target: us-central1; currency: USD.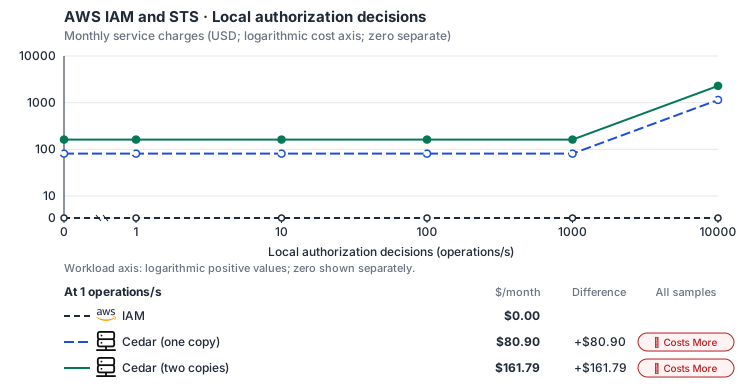
Estimated allocation, not benchmark calibrated: sized from 2 vCPU, 8 GiB memory and 100 GiB SSD at 0 operations/s to 32 vCPU, 128 GiB memory and 100 GiB SSD at 10,000 operations/s.
Curve assumptions
- Monthly operation quantity varies with this steady average rate; stored inventory and other meters retain their defaults. Other native meters and workload assumptions retain their explicitly displayed default quantities. Workload translation and capacity assumptions are not benchmark measurements.
- Native monthly usage priced at the cited provider list prices; listed target allowances apply where present, excluding invoice credits, taxes and negotiated discounts. Rates as of 2026-10-22: us-east-1 → us-central1, USD/month.
- Source prices are reference charges, not an invoice. Target lines cover selected service usage/configuration only; adapter hosting and Tensor9 fees are excluded.
- Samples of explicit prices are not performance measurements or capacity qualification. No interpolation or break-even guarantee is implied.
- Variant assumptions show the first axis sample; any axis-dependent configuration is described by this curve’s workload note.
- Rates are cited provider list prices, editable for discounts, commitments or another region. Workload translation and capacity coefficients remain editable planning assumptions, not benchmark measurements or a commercial quote.
- Default-zero rates are explicit assumptions, not evidence that the deployed service or resource is free.
- Provisioned-unit minimums use an editable approximate allocation floor. Modeled target service cost is max(usage/allocation, minimum), with billable network, durable staging and dependent sinks added separately; actual RU/TU sizing, scaling increments and throughput remain unqualified.
- Durable staging is priced once: provisioned targets include adapter state in their selected allocation; native targets add a separate staging allocation when required. Adapter hosting is a separate allocation and must exclude resources already priced as staging, workers or target capacity.
- A declared adapter mapping and cost model do not establish implementation availability or service equivalence.
- This is a declared directed mapping; a planning estimate does not establish deployment or request-serving support.
- Origin unit prices are cited provider list prices. Retention, amplification, and capacity coefficients are authored planning guesses; they are editable, not measured capacity.
- Free source IAM APIs do not imply zero adapted compute/state cost. In-process Cedar decisions are not separately billed cloud IAM decisions.
- Native policy translation does not create paid Entra seats or premium identity licenses automatically. Those licensed users require explicit separate quantities.
- Self-hosted target: Cedar (Apache-2.0, https://github.com/cedar-policy/cedar/blob/main/LICENSE). Selected CPU, RAM and physical disk allocation grow with workload; no per-operation price is assumed. No vendor charge: the target runs on the customer’s Kubernetes nodes, so CPU, RAM and disk bill at the Kubernetes node reference rates, Compute Engine N2 in us-central1 (USD 0.031611/vCPU-hour, 0.004237/GiB-hour) with pd-balanced disk (0.10/GiB-month) and Premium Tier egress. The cost-optimized E2 series lists 0.02181159/vCPU-hour and 0.00292353/GiB-hour; AWS m6i/r6i and Azure D2s v5/E2s v5 both decompose to 0.033/vCPU-hour and 0.00375/GiB-hour. Requested CPU and RAM are billed; node bin-packing waste, system reservations and the cluster control-plane fee are not.
- Row-store throughput (capacityOpsPerVcpuSecond, default 1500) is measured-by-tensor9 as a lower bound: the DynamoDB adapter on Cloud SQL db-custom-2-7680 (2 vCPU, PostgreSQL 16, us-west1) served 2,974 ops/s of YCSB-A at 16 threads without recorded saturation (src/main/kotlin/t9/prime/equiv/generated/eval/CloudsqlPostgresqlYcsbAT16GoYcsbV1_0_0.kt). Published CPU-bound pgbench reaches 3,101 read-write transactions and 20,289 point reads per vCPU-second (AWS z1d.2xlarge, PostgreSQL 14.5), so actual capacity is likely higher. Reads and writes share one coefficient: at the same adapter version, read-only YCSB-C was not faster than 50%-update YCSB-A.
- Log-broker throughput (capacityStreamMiBPerVcpuSecond 20 at 0.5 utilization, 4 GiB RAM per vCPU) is provider-documented by Google Managed Service for Apache Kafka sizing (https://docs.cloud.google.com/managed-service-for-apache-kafka/docs/plan-cluster-size): write-equivalent bytes are replicated writes plus a quarter of reads. Producer batches below 10 KB lower per-CPU throughput; that penalty is not modeled.
- Disk utilization 0.8 is provider-documented headroom below Cloud SQL automatic storage increase, which triggers near 91-95% full (https://docs.cloud.google.com/sql/docs/postgres/instance-settings). The 20 GiB reserve exceeds PostgreSQL’s 1 GB default max_wal_size; the remainder of that reserve is unmeasured.
- CPU tiers double from 2 vCPUs to the target’s largest node at 4 GiB per vCPU; each target’s documented largest node bounds CPU, RAM, RAM per vCPU and disk, and the durable staging database uses Cloud SQL Enterprise (96 vCPU, 6.5 GiB per vCPU, 624 GiB, 64 TiB). Targets billed per capacity unit or throughput unit are sized by their backend instead.
- No public evidence: peak/mean work (2) and the RAM working-set fraction (0.1). Proposed measurements: the p99 one-minute rate over the monthly mean from customer CloudWatch metrics; the buffer hit ratio while stepping RAM under a fixed YCSB-B load.
- Node bounds: Cloud SQL Enterprise allows 1-96 vCPUs at 0.9-6.5 GB per vCPU and up to 64 TB with a dedicated vCPU (https://docs.cloud.google.com/sql/docs/postgres/instance-settings).
- Stored GiB already includes the origin family’s physical footprint assumptions; no second storage amplification is applied.
- The operations/vCPU coefficient supplies the compute requirement alongside explicit resource-hour minima.
- Copies and allocation fractions change cost only; they do not increase modeled primary capacity.
- AWS IAM User Guide: What is IAM: https://docs.aws.amazon.com/IAM/latest/UserGuide/introduction.html
- Compute Engine general-purpose machine pricing: https://cloud.google.com/products/compute/pricing/general-purpose
- Disk and image pricing: https://cloud.google.com/compute/disks-image-pricing
- Network pricing: https://cloud.google.com/vpc/network-pricing
- Free allowances, committed discounts, credits, taxes and negotiated rates.
- Commercial Tensor9 fees and operations labor unless entered separately.
- Premium identity licenses, external federation providers, directory synchronization and all protected resource-service charges.
- Taxes, discounts, credits and free-tier allowances not explicitly listed by this model.
- Unmodeled dependent services, task execution and operations outside the selected workload family.
plan-2337a2bb066032b30f6de3e2e31d3c204810929d / 2026-10-22.planning.2. Curve: workload-1.
Sources: AWS IAM User Guide: What is IAM, Compute Engine general-purpose machine pricing, Disk and image pricing, Network pricing.
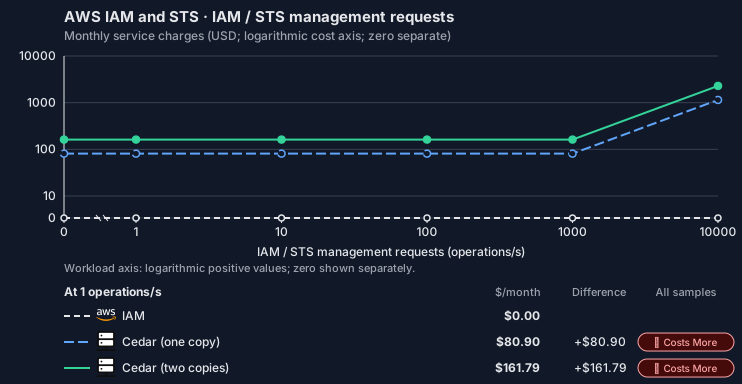
AWS IAM and STS · IAM / STS management requests
Feature: AWS IAM and STS. Estimated monthly service charges by IAM / STS management requests. Adapter hosting and Tensor9 fees are excluded. Source: us-east-1; target: us-central1; currency: USD.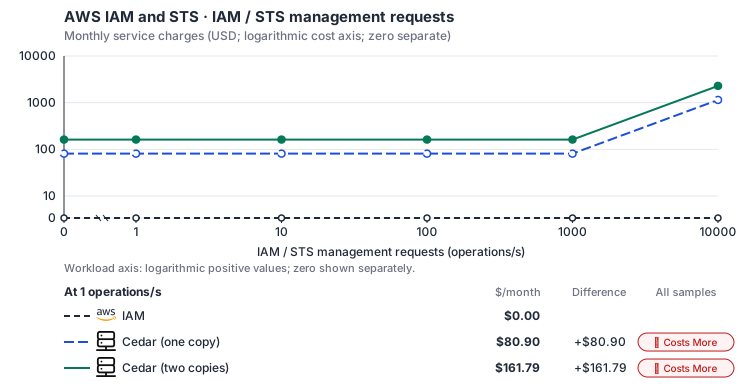
Estimated allocation, not benchmark calibrated: sized from 2 vCPU, 8 GiB memory and 100 GiB SSD at 0 operations/s to 32 vCPU, 128 GiB memory and 100 GiB SSD at 10,000 operations/s.
Curve assumptions
- Monthly operation quantity varies with this steady average rate; stored inventory and other meters retain their defaults. Other native meters and workload assumptions retain their explicitly displayed default quantities. Workload translation and capacity assumptions are not benchmark measurements.
- Native monthly usage priced at the cited provider list prices; listed target allowances apply where present, excluding invoice credits, taxes and negotiated discounts. Rates as of 2026-10-22: us-east-1 → us-central1, USD/month.
- Source prices are reference charges, not an invoice. Target lines cover selected service usage/configuration only; adapter hosting and Tensor9 fees are excluded.
- Samples of explicit prices are not performance measurements or capacity qualification. No interpolation or break-even guarantee is implied.
- Variant assumptions show the first axis sample; any axis-dependent configuration is described by this curve’s workload note.
- Rates are cited provider list prices, editable for discounts, commitments or another region. Workload translation and capacity coefficients remain editable planning assumptions, not benchmark measurements or a commercial quote.
- Default-zero rates are explicit assumptions, not evidence that the deployed service or resource is free.
- Provisioned-unit minimums use an editable approximate allocation floor. Modeled target service cost is max(usage/allocation, minimum), with billable network, durable staging and dependent sinks added separately; actual RU/TU sizing, scaling increments and throughput remain unqualified.
- Durable staging is priced once: provisioned targets include adapter state in their selected allocation; native targets add a separate staging allocation when required. Adapter hosting is a separate allocation and must exclude resources already priced as staging, workers or target capacity.
- A declared adapter mapping and cost model do not establish implementation availability or service equivalence.
- This is a declared directed mapping; a planning estimate does not establish deployment or request-serving support.
- Origin unit prices are cited provider list prices. Retention, amplification, and capacity coefficients are authored planning guesses; they are editable, not measured capacity.
- Free source IAM APIs do not imply zero adapted compute/state cost. In-process Cedar decisions are not separately billed cloud IAM decisions.
- Native policy translation does not create paid Entra seats or premium identity licenses automatically. Those licensed users require explicit separate quantities.
- Self-hosted target: Cedar (Apache-2.0, https://github.com/cedar-policy/cedar/blob/main/LICENSE). Selected CPU, RAM and physical disk allocation grow with workload; no per-operation price is assumed. No vendor charge: the target runs on the customer’s Kubernetes nodes, so CPU, RAM and disk bill at the Kubernetes node reference rates, Compute Engine N2 in us-central1 (USD 0.031611/vCPU-hour, 0.004237/GiB-hour) with pd-balanced disk (0.10/GiB-month) and Premium Tier egress. The cost-optimized E2 series lists 0.02181159/vCPU-hour and 0.00292353/GiB-hour; AWS m6i/r6i and Azure D2s v5/E2s v5 both decompose to 0.033/vCPU-hour and 0.00375/GiB-hour. Requested CPU and RAM are billed; node bin-packing waste, system reservations and the cluster control-plane fee are not.
- Row-store throughput (capacityOpsPerVcpuSecond, default 1500) is measured-by-tensor9 as a lower bound: the DynamoDB adapter on Cloud SQL db-custom-2-7680 (2 vCPU, PostgreSQL 16, us-west1) served 2,974 ops/s of YCSB-A at 16 threads without recorded saturation (src/main/kotlin/t9/prime/equiv/generated/eval/CloudsqlPostgresqlYcsbAT16GoYcsbV1_0_0.kt). Published CPU-bound pgbench reaches 3,101 read-write transactions and 20,289 point reads per vCPU-second (AWS z1d.2xlarge, PostgreSQL 14.5), so actual capacity is likely higher. Reads and writes share one coefficient: at the same adapter version, read-only YCSB-C was not faster than 50%-update YCSB-A.
- Log-broker throughput (capacityStreamMiBPerVcpuSecond 20 at 0.5 utilization, 4 GiB RAM per vCPU) is provider-documented by Google Managed Service for Apache Kafka sizing (https://docs.cloud.google.com/managed-service-for-apache-kafka/docs/plan-cluster-size): write-equivalent bytes are replicated writes plus a quarter of reads. Producer batches below 10 KB lower per-CPU throughput; that penalty is not modeled.
- Disk utilization 0.8 is provider-documented headroom below Cloud SQL automatic storage increase, which triggers near 91-95% full (https://docs.cloud.google.com/sql/docs/postgres/instance-settings). The 20 GiB reserve exceeds PostgreSQL’s 1 GB default max_wal_size; the remainder of that reserve is unmeasured.
- CPU tiers double from 2 vCPUs to the target’s largest node at 4 GiB per vCPU; each target’s documented largest node bounds CPU, RAM, RAM per vCPU and disk, and the durable staging database uses Cloud SQL Enterprise (96 vCPU, 6.5 GiB per vCPU, 624 GiB, 64 TiB). Targets billed per capacity unit or throughput unit are sized by their backend instead.
- No public evidence: peak/mean work (2) and the RAM working-set fraction (0.1). Proposed measurements: the p99 one-minute rate over the monthly mean from customer CloudWatch metrics; the buffer hit ratio while stepping RAM under a fixed YCSB-B load.
- Node bounds: Cloud SQL Enterprise allows 1-96 vCPUs at 0.9-6.5 GB per vCPU and up to 64 TB with a dedicated vCPU (https://docs.cloud.google.com/sql/docs/postgres/instance-settings).
- Stored GiB already includes the origin family’s physical footprint assumptions; no second storage amplification is applied.
- The operations/vCPU coefficient supplies the compute requirement alongside explicit resource-hour minima.
- Copies and allocation fractions change cost only; they do not increase modeled primary capacity.
- AWS IAM User Guide: What is IAM: https://docs.aws.amazon.com/IAM/latest/UserGuide/introduction.html
- Compute Engine general-purpose machine pricing: https://cloud.google.com/products/compute/pricing/general-purpose
- Disk and image pricing: https://cloud.google.com/compute/disks-image-pricing
- Network pricing: https://cloud.google.com/vpc/network-pricing
- Free allowances, committed discounts, credits, taxes and negotiated rates.
- Commercial Tensor9 fees and operations labor unless entered separately.
- Premium identity licenses, external federation providers, directory synchronization and all protected resource-service charges.
- Taxes, discounts, credits and free-tier allowances not explicitly listed by this model.
- Unmodeled dependent services, task execution and operations outside the selected workload family.
plan-2337a2bb066032b30f6de3e2e31d3c204810929d / 2026-10-22.planning.2. Curve: workload-2.
Sources: AWS IAM User Guide: What is IAM, Compute Engine general-purpose machine pricing, Disk and image pricing, Network pricing.
AWS IAM and STS → IAM
Origin API:aws::1.0.0::iam. Target backend: azure::1.0.0::iam.
Native or deployment mapping. This mapping provisions native target-cloud permissions. Application authorization uses the target cloud’s identity system; requests do not pass through an IAM service adapter. The IAM-to-Cedar adapter has separate service levels. Cost estimates describe the selected service resources; operation coverage remains separate.
AWS IAM and STS · Local authorization decisions
Feature: AWS IAM and STS. Estimated monthly service charges by Local authorization decisions. Adapter hosting and Tensor9 fees are excluded. Source: us-east-1; target: global; currency: USD.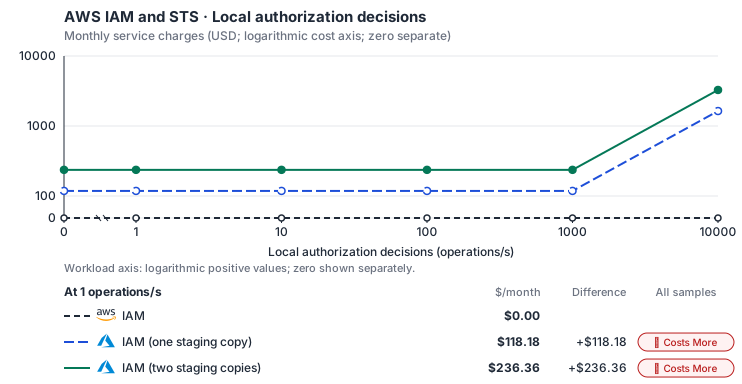
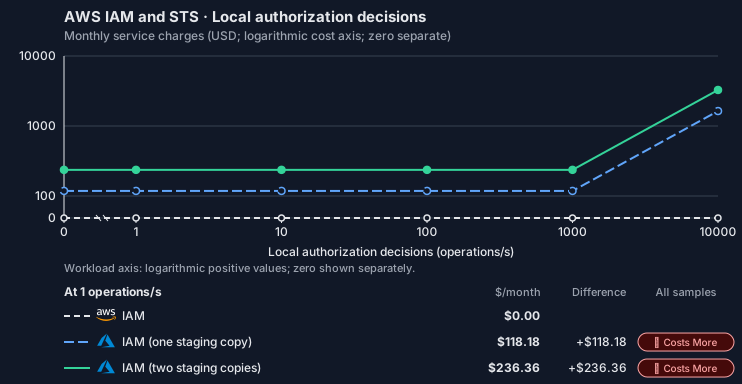
Estimated allocation, not benchmark calibrated: sized from 2 vCPU, 8 GiB memory and 100 GiB SSD at 0 operations/s to 32 vCPU, 128 GiB memory and 100 GiB SSD at 10,000 operations/s.
Curve assumptions
- Monthly operation quantity varies with this steady average rate; stored inventory and other meters retain their defaults. Other native meters and workload assumptions retain their explicitly displayed default quantities. Workload translation and capacity assumptions are not benchmark measurements.
- Native monthly usage priced at the cited provider list prices; listed target allowances apply where present, excluding invoice credits, taxes and negotiated discounts. Rates as of 2026-10-22: us-east-1 → global, USD/month.
- Source prices are reference charges, not an invoice. Target lines cover selected service usage/configuration only; adapter hosting and Tensor9 fees are excluded.
- Samples of explicit prices are not performance measurements or capacity qualification. No interpolation or break-even guarantee is implied.
- Variant assumptions show the first axis sample; any axis-dependent configuration is described by this curve’s workload note.
- Rates are cited provider list prices, editable for discounts, commitments or another region. Workload translation and capacity coefficients remain editable planning assumptions, not benchmark measurements or a commercial quote.
- Default-zero rates are explicit assumptions, not evidence that the deployed service or resource is free.
- Provisioned-unit minimums use an editable approximate allocation floor. Modeled target service cost is max(usage/allocation, minimum), with billable network, durable staging and dependent sinks added separately; actual RU/TU sizing, scaling increments and throughput remain unqualified.
- Durable staging is priced once: provisioned targets include adapter state in their selected allocation; native targets add a separate staging allocation when required. Adapter hosting is a separate allocation and must exclude resources already priced as staging, workers or target capacity.
- A declared adapter mapping and cost model do not establish implementation availability or service equivalence.
- This is a declared directed mapping; a planning estimate does not establish deployment or request-serving support.
- Native/deployment comparison scope: This mapping provisions native target-cloud permissions. Application authorization uses the target cloud’s identity system; requests do not pass through an IAM service adapter. The IAM-to-Cedar adapter has separate service levels.
- Origin unit prices are cited provider list prices. Retention, amplification, and capacity coefficients are authored planning guesses; they are editable, not measured capacity.
- Free source IAM APIs do not imply zero adapted compute/state cost. In-process Cedar decisions are not separately billed cloud IAM decisions.
- Native policy translation does not create paid Entra seats or premium identity licenses automatically. Those licensed users require explicit separate quantities.
- Identity and access management APIs are free. Durable adapter state and hosting remain independent costs.
- Row-store throughput (capacityOpsPerVcpuSecond, default 1500) is measured-by-tensor9 as a lower bound: the DynamoDB adapter on Cloud SQL db-custom-2-7680 (2 vCPU, PostgreSQL 16, us-west1) served 2,974 ops/s of YCSB-A at 16 threads without recorded saturation (src/main/kotlin/t9/prime/equiv/generated/eval/CloudsqlPostgresqlYcsbAT16GoYcsbV1_0_0.kt). Published CPU-bound pgbench reaches 3,101 read-write transactions and 20,289 point reads per vCPU-second (AWS z1d.2xlarge, PostgreSQL 14.5), so actual capacity is likely higher. Reads and writes share one coefficient: at the same adapter version, read-only YCSB-C was not faster than 50%-update YCSB-A.
- Log-broker throughput (capacityStreamMiBPerVcpuSecond 20 at 0.5 utilization, 4 GiB RAM per vCPU) is provider-documented by Google Managed Service for Apache Kafka sizing (https://docs.cloud.google.com/managed-service-for-apache-kafka/docs/plan-cluster-size): write-equivalent bytes are replicated writes plus a quarter of reads. Producer batches below 10 KB lower per-CPU throughput; that penalty is not modeled.
- Disk utilization 0.8 is provider-documented headroom below Cloud SQL automatic storage increase, which triggers near 91-95% full (https://docs.cloud.google.com/sql/docs/postgres/instance-settings). The 20 GiB reserve exceeds PostgreSQL’s 1 GB default max_wal_size; the remainder of that reserve is unmeasured.
- CPU tiers double from 2 vCPUs to the target’s largest node at 4 GiB per vCPU; each target’s documented largest node bounds CPU, RAM, RAM per vCPU and disk, and the durable staging database uses Cloud SQL Enterprise (96 vCPU, 6.5 GiB per vCPU, 624 GiB, 64 TiB). Targets billed per capacity unit or throughput unit are sized by their backend instead.
- No public evidence: peak/mean work (2) and the RAM working-set fraction (0.1). Proposed measurements: the p99 one-minute rate over the monthly mean from customer CloudWatch metrics; the buffer hit ratio while stepping RAM under a fixed YCSB-B load.
- Node bounds: Cloud SQL Enterprise allows 1-96 vCPUs at 0.9-6.5 GB per vCPU and up to 64 TB with a dedicated vCPU (https://docs.cloud.google.com/sql/docs/postgres/instance-settings).
- Stored GiB already includes the origin family’s physical footprint assumptions; no second storage amplification is applied.
- The operations/vCPU coefficient supplies the compute requirement alongside explicit resource-hour minima.
- Copies and allocation fractions change cost only; they do not increase modeled primary capacity.
- AWS IAM User Guide: What is IAM: https://docs.aws.amazon.com/IAM/latest/UserGuide/introduction.html
- What is Azure role-based access control (Azure RBAC)?: https://learn.microsoft.com/en-us/azure/role-based-access-control/overview
- Free allowances, committed discounts, credits, taxes and negotiated rates.
- Commercial Tensor9 fees and operations labor unless entered separately.
- Premium identity licenses, external federation providers, directory synchronization and all protected resource-service charges.
- Taxes, discounts, credits and free-tier allowances not explicitly listed by this model.
- Unmodeled dependent services, task execution and operations outside the selected workload family.
plan-4aa30b86f1d9e528a7c4e3b167be549830f739b3 / 2026-10-22.planning.2. Curve: workload-1.
Sources: AWS IAM User Guide: What is IAM, What is Azure role-based access control (Azure RBAC)?.
AWS IAM and STS · IAM / STS management requests
Feature: AWS IAM and STS. Estimated monthly service charges by IAM / STS management requests. Adapter hosting and Tensor9 fees are excluded. Source: us-east-1; target: global; currency: USD.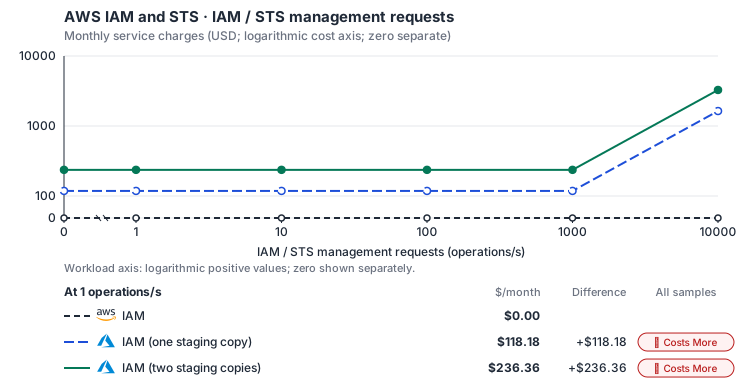
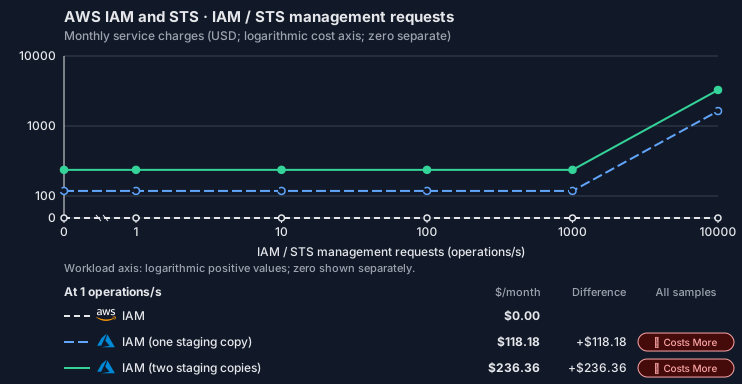
Estimated allocation, not benchmark calibrated: sized from 2 vCPU, 8 GiB memory and 100 GiB SSD at 0 operations/s to 32 vCPU, 128 GiB memory and 100 GiB SSD at 10,000 operations/s.
Curve assumptions
- Monthly operation quantity varies with this steady average rate; stored inventory and other meters retain their defaults. Other native meters and workload assumptions retain their explicitly displayed default quantities. Workload translation and capacity assumptions are not benchmark measurements.
- Native monthly usage priced at the cited provider list prices; listed target allowances apply where present, excluding invoice credits, taxes and negotiated discounts. Rates as of 2026-10-22: us-east-1 → global, USD/month.
- Source prices are reference charges, not an invoice. Target lines cover selected service usage/configuration only; adapter hosting and Tensor9 fees are excluded.
- Samples of explicit prices are not performance measurements or capacity qualification. No interpolation or break-even guarantee is implied.
- Variant assumptions show the first axis sample; any axis-dependent configuration is described by this curve’s workload note.
- Rates are cited provider list prices, editable for discounts, commitments or another region. Workload translation and capacity coefficients remain editable planning assumptions, not benchmark measurements or a commercial quote.
- Default-zero rates are explicit assumptions, not evidence that the deployed service or resource is free.
- Provisioned-unit minimums use an editable approximate allocation floor. Modeled target service cost is max(usage/allocation, minimum), with billable network, durable staging and dependent sinks added separately; actual RU/TU sizing, scaling increments and throughput remain unqualified.
- Durable staging is priced once: provisioned targets include adapter state in their selected allocation; native targets add a separate staging allocation when required. Adapter hosting is a separate allocation and must exclude resources already priced as staging, workers or target capacity.
- A declared adapter mapping and cost model do not establish implementation availability or service equivalence.
- This is a declared directed mapping; a planning estimate does not establish deployment or request-serving support.
- Native/deployment comparison scope: This mapping provisions native target-cloud permissions. Application authorization uses the target cloud’s identity system; requests do not pass through an IAM service adapter. The IAM-to-Cedar adapter has separate service levels.
- Origin unit prices are cited provider list prices. Retention, amplification, and capacity coefficients are authored planning guesses; they are editable, not measured capacity.
- Free source IAM APIs do not imply zero adapted compute/state cost. In-process Cedar decisions are not separately billed cloud IAM decisions.
- Native policy translation does not create paid Entra seats or premium identity licenses automatically. Those licensed users require explicit separate quantities.
- Identity and access management APIs are free. Durable adapter state and hosting remain independent costs.
- Row-store throughput (capacityOpsPerVcpuSecond, default 1500) is measured-by-tensor9 as a lower bound: the DynamoDB adapter on Cloud SQL db-custom-2-7680 (2 vCPU, PostgreSQL 16, us-west1) served 2,974 ops/s of YCSB-A at 16 threads without recorded saturation (src/main/kotlin/t9/prime/equiv/generated/eval/CloudsqlPostgresqlYcsbAT16GoYcsbV1_0_0.kt). Published CPU-bound pgbench reaches 3,101 read-write transactions and 20,289 point reads per vCPU-second (AWS z1d.2xlarge, PostgreSQL 14.5), so actual capacity is likely higher. Reads and writes share one coefficient: at the same adapter version, read-only YCSB-C was not faster than 50%-update YCSB-A.
- Log-broker throughput (capacityStreamMiBPerVcpuSecond 20 at 0.5 utilization, 4 GiB RAM per vCPU) is provider-documented by Google Managed Service for Apache Kafka sizing (https://docs.cloud.google.com/managed-service-for-apache-kafka/docs/plan-cluster-size): write-equivalent bytes are replicated writes plus a quarter of reads. Producer batches below 10 KB lower per-CPU throughput; that penalty is not modeled.
- Disk utilization 0.8 is provider-documented headroom below Cloud SQL automatic storage increase, which triggers near 91-95% full (https://docs.cloud.google.com/sql/docs/postgres/instance-settings). The 20 GiB reserve exceeds PostgreSQL’s 1 GB default max_wal_size; the remainder of that reserve is unmeasured.
- CPU tiers double from 2 vCPUs to the target’s largest node at 4 GiB per vCPU; each target’s documented largest node bounds CPU, RAM, RAM per vCPU and disk, and the durable staging database uses Cloud SQL Enterprise (96 vCPU, 6.5 GiB per vCPU, 624 GiB, 64 TiB). Targets billed per capacity unit or throughput unit are sized by their backend instead.
- No public evidence: peak/mean work (2) and the RAM working-set fraction (0.1). Proposed measurements: the p99 one-minute rate over the monthly mean from customer CloudWatch metrics; the buffer hit ratio while stepping RAM under a fixed YCSB-B load.
- Node bounds: Cloud SQL Enterprise allows 1-96 vCPUs at 0.9-6.5 GB per vCPU and up to 64 TB with a dedicated vCPU (https://docs.cloud.google.com/sql/docs/postgres/instance-settings).
- Stored GiB already includes the origin family’s physical footprint assumptions; no second storage amplification is applied.
- The operations/vCPU coefficient supplies the compute requirement alongside explicit resource-hour minima.
- Copies and allocation fractions change cost only; they do not increase modeled primary capacity.
- AWS IAM User Guide: What is IAM: https://docs.aws.amazon.com/IAM/latest/UserGuide/introduction.html
- What is Azure role-based access control (Azure RBAC)?: https://learn.microsoft.com/en-us/azure/role-based-access-control/overview
- Free allowances, committed discounts, credits, taxes and negotiated rates.
- Commercial Tensor9 fees and operations labor unless entered separately.
- Premium identity licenses, external federation providers, directory synchronization and all protected resource-service charges.
- Taxes, discounts, credits and free-tier allowances not explicitly listed by this model.
- Unmodeled dependent services, task execution and operations outside the selected workload family.
plan-4aa30b86f1d9e528a7c4e3b167be549830f739b3 / 2026-10-22.planning.2. Curve: workload-2.
Sources: AWS IAM User Guide: What is IAM, What is Azure role-based access control (Azure RBAC)?.
AWS IAM and STS → IAM
Origin API:aws::1.0.0::iam. Target backend: google::1.0.0::iam.
Native or deployment mapping. This mapping provisions native target-cloud permissions. Application authorization uses the target cloud’s identity system; requests do not pass through an IAM service adapter. The IAM-to-Cedar adapter has separate service levels. Cost estimates describe the selected service resources; operation coverage remains separate.
AWS IAM and STS · Local authorization decisions
Feature: AWS IAM and STS. Estimated monthly service charges by Local authorization decisions. Adapter hosting and Tensor9 fees are excluded. Source: us-east-1; target: global; currency: USD.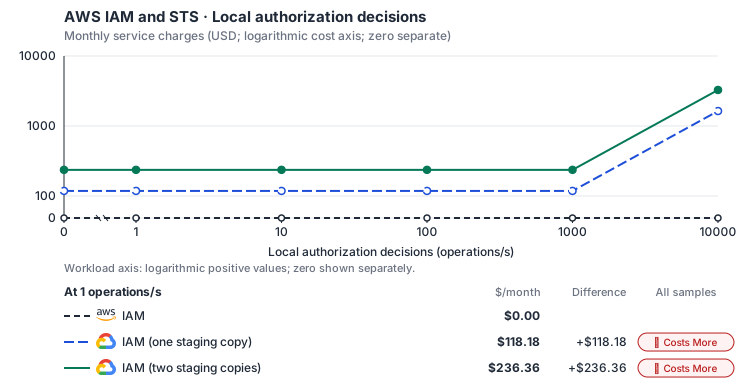
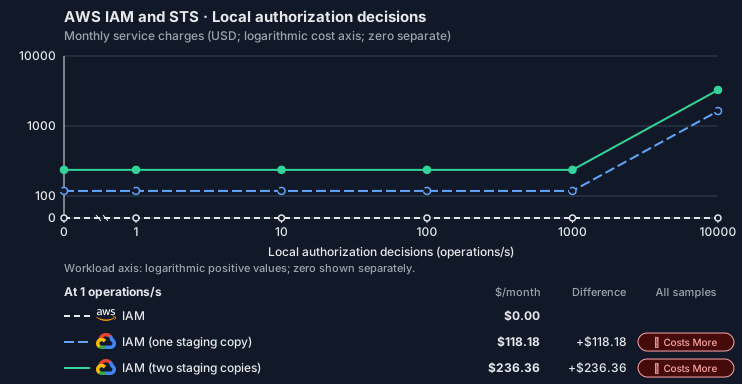
Estimated allocation, not benchmark calibrated: sized from 2 vCPU, 8 GiB memory and 100 GiB SSD at 0 operations/s to 32 vCPU, 128 GiB memory and 100 GiB SSD at 10,000 operations/s.
Curve assumptions
- Monthly operation quantity varies with this steady average rate; stored inventory and other meters retain their defaults. Other native meters and workload assumptions retain their explicitly displayed default quantities. Workload translation and capacity assumptions are not benchmark measurements.
- Native monthly usage priced at the cited provider list prices; listed target allowances apply where present, excluding invoice credits, taxes and negotiated discounts. Rates as of 2026-10-22: us-east-1 → global, USD/month.
- Source prices are reference charges, not an invoice. Target lines cover selected service usage/configuration only; adapter hosting and Tensor9 fees are excluded.
- Samples of explicit prices are not performance measurements or capacity qualification. No interpolation or break-even guarantee is implied.
- Variant assumptions show the first axis sample; any axis-dependent configuration is described by this curve’s workload note.
- Rates are cited provider list prices, editable for discounts, commitments or another region. Workload translation and capacity coefficients remain editable planning assumptions, not benchmark measurements or a commercial quote.
- Default-zero rates are explicit assumptions, not evidence that the deployed service or resource is free.
- Provisioned-unit minimums use an editable approximate allocation floor. Modeled target service cost is max(usage/allocation, minimum), with billable network, durable staging and dependent sinks added separately; actual RU/TU sizing, scaling increments and throughput remain unqualified.
- Durable staging is priced once: provisioned targets include adapter state in their selected allocation; native targets add a separate staging allocation when required. Adapter hosting is a separate allocation and must exclude resources already priced as staging, workers or target capacity.
- A declared adapter mapping and cost model do not establish implementation availability or service equivalence.
- This is a declared directed mapping; a planning estimate does not establish deployment or request-serving support.
- Native/deployment comparison scope: This mapping provisions native target-cloud permissions. Application authorization uses the target cloud’s identity system; requests do not pass through an IAM service adapter. The IAM-to-Cedar adapter has separate service levels.
- Origin unit prices are cited provider list prices. Retention, amplification, and capacity coefficients are authored planning guesses; they are editable, not measured capacity.
- Free source IAM APIs do not imply zero adapted compute/state cost. In-process Cedar decisions are not separately billed cloud IAM decisions.
- Native policy translation does not create paid Entra seats or premium identity licenses automatically. Those licensed users require explicit separate quantities.
- Identity and access management APIs are free. Durable adapter state and hosting remain independent costs.
- Row-store throughput (capacityOpsPerVcpuSecond, default 1500) is measured-by-tensor9 as a lower bound: the DynamoDB adapter on Cloud SQL db-custom-2-7680 (2 vCPU, PostgreSQL 16, us-west1) served 2,974 ops/s of YCSB-A at 16 threads without recorded saturation (src/main/kotlin/t9/prime/equiv/generated/eval/CloudsqlPostgresqlYcsbAT16GoYcsbV1_0_0.kt). Published CPU-bound pgbench reaches 3,101 read-write transactions and 20,289 point reads per vCPU-second (AWS z1d.2xlarge, PostgreSQL 14.5), so actual capacity is likely higher. Reads and writes share one coefficient: at the same adapter version, read-only YCSB-C was not faster than 50%-update YCSB-A.
- Log-broker throughput (capacityStreamMiBPerVcpuSecond 20 at 0.5 utilization, 4 GiB RAM per vCPU) is provider-documented by Google Managed Service for Apache Kafka sizing (https://docs.cloud.google.com/managed-service-for-apache-kafka/docs/plan-cluster-size): write-equivalent bytes are replicated writes plus a quarter of reads. Producer batches below 10 KB lower per-CPU throughput; that penalty is not modeled.
- Disk utilization 0.8 is provider-documented headroom below Cloud SQL automatic storage increase, which triggers near 91-95% full (https://docs.cloud.google.com/sql/docs/postgres/instance-settings). The 20 GiB reserve exceeds PostgreSQL’s 1 GB default max_wal_size; the remainder of that reserve is unmeasured.
- CPU tiers double from 2 vCPUs to the target’s largest node at 4 GiB per vCPU; each target’s documented largest node bounds CPU, RAM, RAM per vCPU and disk, and the durable staging database uses Cloud SQL Enterprise (96 vCPU, 6.5 GiB per vCPU, 624 GiB, 64 TiB). Targets billed per capacity unit or throughput unit are sized by their backend instead.
- No public evidence: peak/mean work (2) and the RAM working-set fraction (0.1). Proposed measurements: the p99 one-minute rate over the monthly mean from customer CloudWatch metrics; the buffer hit ratio while stepping RAM under a fixed YCSB-B load.
- Node bounds: Cloud SQL Enterprise allows 1-96 vCPUs at 0.9-6.5 GB per vCPU and up to 64 TB with a dedicated vCPU (https://docs.cloud.google.com/sql/docs/postgres/instance-settings).
- Stored GiB already includes the origin family’s physical footprint assumptions; no second storage amplification is applied.
- The operations/vCPU coefficient supplies the compute requirement alongside explicit resource-hour minima.
- Copies and allocation fractions change cost only; they do not increase modeled primary capacity.
- AWS IAM User Guide: What is IAM: https://docs.aws.amazon.com/IAM/latest/UserGuide/introduction.html
- IAM pricing: https://cloud.google.com/iam/pricing
- Free allowances, committed discounts, credits, taxes and negotiated rates.
- Commercial Tensor9 fees and operations labor unless entered separately.
- Premium identity licenses, external federation providers, directory synchronization and all protected resource-service charges.
- Taxes, discounts, credits and free-tier allowances not explicitly listed by this model.
- Unmodeled dependent services, task execution and operations outside the selected workload family.
plan-9ae61cc2693ea509da57c8030bc42025f671c79b / 2026-10-22.planning.2. Curve: workload-1.
Sources: AWS IAM User Guide: What is IAM, IAM pricing.
AWS IAM and STS · IAM / STS management requests
Feature: AWS IAM and STS. Estimated monthly service charges by IAM / STS management requests. Adapter hosting and Tensor9 fees are excluded. Source: us-east-1; target: global; currency: USD.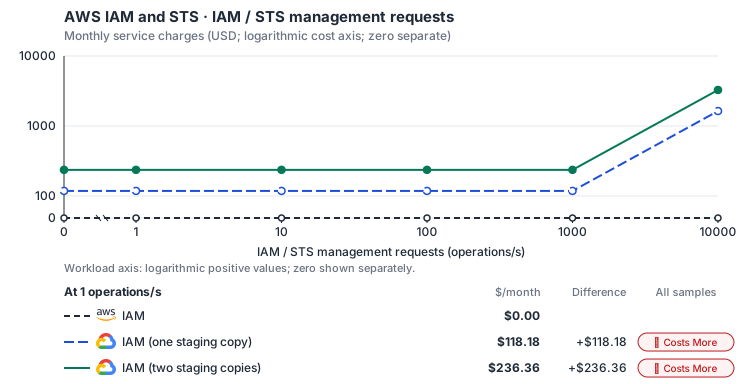
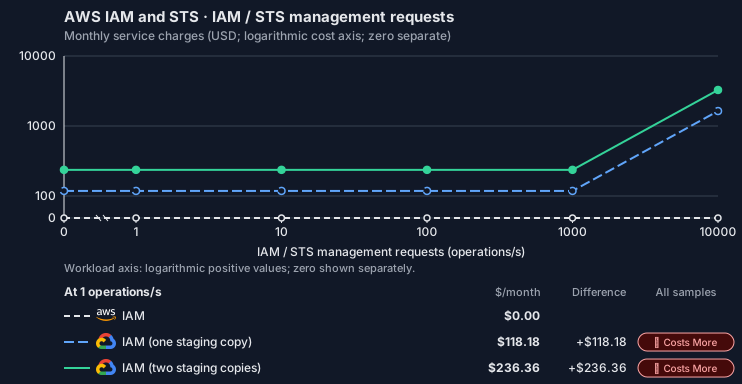
Estimated allocation, not benchmark calibrated: sized from 2 vCPU, 8 GiB memory and 100 GiB SSD at 0 operations/s to 32 vCPU, 128 GiB memory and 100 GiB SSD at 10,000 operations/s.
Curve assumptions
- Monthly operation quantity varies with this steady average rate; stored inventory and other meters retain their defaults. Other native meters and workload assumptions retain their explicitly displayed default quantities. Workload translation and capacity assumptions are not benchmark measurements.
- Native monthly usage priced at the cited provider list prices; listed target allowances apply where present, excluding invoice credits, taxes and negotiated discounts. Rates as of 2026-10-22: us-east-1 → global, USD/month.
- Source prices are reference charges, not an invoice. Target lines cover selected service usage/configuration only; adapter hosting and Tensor9 fees are excluded.
- Samples of explicit prices are not performance measurements or capacity qualification. No interpolation or break-even guarantee is implied.
- Variant assumptions show the first axis sample; any axis-dependent configuration is described by this curve’s workload note.
- Rates are cited provider list prices, editable for discounts, commitments or another region. Workload translation and capacity coefficients remain editable planning assumptions, not benchmark measurements or a commercial quote.
- Default-zero rates are explicit assumptions, not evidence that the deployed service or resource is free.
- Provisioned-unit minimums use an editable approximate allocation floor. Modeled target service cost is max(usage/allocation, minimum), with billable network, durable staging and dependent sinks added separately; actual RU/TU sizing, scaling increments and throughput remain unqualified.
- Durable staging is priced once: provisioned targets include adapter state in their selected allocation; native targets add a separate staging allocation when required. Adapter hosting is a separate allocation and must exclude resources already priced as staging, workers or target capacity.
- A declared adapter mapping and cost model do not establish implementation availability or service equivalence.
- This is a declared directed mapping; a planning estimate does not establish deployment or request-serving support.
- Native/deployment comparison scope: This mapping provisions native target-cloud permissions. Application authorization uses the target cloud’s identity system; requests do not pass through an IAM service adapter. The IAM-to-Cedar adapter has separate service levels.
- Origin unit prices are cited provider list prices. Retention, amplification, and capacity coefficients are authored planning guesses; they are editable, not measured capacity.
- Free source IAM APIs do not imply zero adapted compute/state cost. In-process Cedar decisions are not separately billed cloud IAM decisions.
- Native policy translation does not create paid Entra seats or premium identity licenses automatically. Those licensed users require explicit separate quantities.
- Identity and access management APIs are free. Durable adapter state and hosting remain independent costs.
- Row-store throughput (capacityOpsPerVcpuSecond, default 1500) is measured-by-tensor9 as a lower bound: the DynamoDB adapter on Cloud SQL db-custom-2-7680 (2 vCPU, PostgreSQL 16, us-west1) served 2,974 ops/s of YCSB-A at 16 threads without recorded saturation (src/main/kotlin/t9/prime/equiv/generated/eval/CloudsqlPostgresqlYcsbAT16GoYcsbV1_0_0.kt). Published CPU-bound pgbench reaches 3,101 read-write transactions and 20,289 point reads per vCPU-second (AWS z1d.2xlarge, PostgreSQL 14.5), so actual capacity is likely higher. Reads and writes share one coefficient: at the same adapter version, read-only YCSB-C was not faster than 50%-update YCSB-A.
- Log-broker throughput (capacityStreamMiBPerVcpuSecond 20 at 0.5 utilization, 4 GiB RAM per vCPU) is provider-documented by Google Managed Service for Apache Kafka sizing (https://docs.cloud.google.com/managed-service-for-apache-kafka/docs/plan-cluster-size): write-equivalent bytes are replicated writes plus a quarter of reads. Producer batches below 10 KB lower per-CPU throughput; that penalty is not modeled.
- Disk utilization 0.8 is provider-documented headroom below Cloud SQL automatic storage increase, which triggers near 91-95% full (https://docs.cloud.google.com/sql/docs/postgres/instance-settings). The 20 GiB reserve exceeds PostgreSQL’s 1 GB default max_wal_size; the remainder of that reserve is unmeasured.
- CPU tiers double from 2 vCPUs to the target’s largest node at 4 GiB per vCPU; each target’s documented largest node bounds CPU, RAM, RAM per vCPU and disk, and the durable staging database uses Cloud SQL Enterprise (96 vCPU, 6.5 GiB per vCPU, 624 GiB, 64 TiB). Targets billed per capacity unit or throughput unit are sized by their backend instead.
- No public evidence: peak/mean work (2) and the RAM working-set fraction (0.1). Proposed measurements: the p99 one-minute rate over the monthly mean from customer CloudWatch metrics; the buffer hit ratio while stepping RAM under a fixed YCSB-B load.
- Node bounds: Cloud SQL Enterprise allows 1-96 vCPUs at 0.9-6.5 GB per vCPU and up to 64 TB with a dedicated vCPU (https://docs.cloud.google.com/sql/docs/postgres/instance-settings).
- Stored GiB already includes the origin family’s physical footprint assumptions; no second storage amplification is applied.
- The operations/vCPU coefficient supplies the compute requirement alongside explicit resource-hour minima.
- Copies and allocation fractions change cost only; they do not increase modeled primary capacity.
- AWS IAM User Guide: What is IAM: https://docs.aws.amazon.com/IAM/latest/UserGuide/introduction.html
- IAM pricing: https://cloud.google.com/iam/pricing
- Free allowances, committed discounts, credits, taxes and negotiated rates.
- Commercial Tensor9 fees and operations labor unless entered separately.
- Premium identity licenses, external federation providers, directory synchronization and all protected resource-service charges.
- Taxes, discounts, credits and free-tier allowances not explicitly listed by this model.
- Unmodeled dependent services, task execution and operations outside the selected workload family.
plan-9ae61cc2693ea509da57c8030bc42025f671c79b / 2026-10-22.planning.2. Curve: workload-2.
Sources: AWS IAM User Guide: What is IAM, IAM pricing.
AWS IAM and STS → OCI IAM
Origin API:aws::1.0.0::iam. Target backend: oci::1.0.0::iam.
Native or deployment mapping. This mapping provisions native target-cloud permissions. Application authorization uses the target cloud’s identity system; requests do not pass through an IAM service adapter. The IAM-to-Cedar adapter has separate service levels. Cost estimates describe the selected service resources; operation coverage remains separate.
AWS IAM and STS · Local authorization decisions
Feature: AWS IAM and STS. Estimated monthly service charges by Local authorization decisions. Adapter hosting and Tensor9 fees are excluded. Source: us-east-1; target: us-ashburn-1; currency: USD.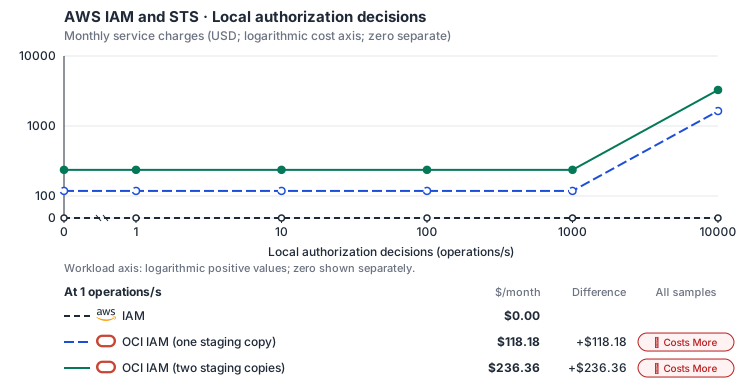
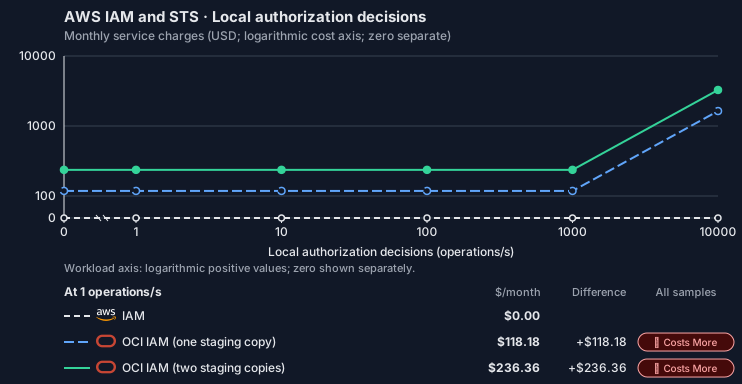
Estimated allocation, not benchmark calibrated: sized from 2 vCPU, 8 GiB memory and 100 GiB SSD at 0 operations/s to 32 vCPU, 128 GiB memory and 100 GiB SSD at 10,000 operations/s.
Curve assumptions
- Monthly operation quantity varies with this steady average rate; stored inventory and other meters retain their defaults. Other native meters and workload assumptions retain their explicitly displayed default quantities. Workload translation and capacity assumptions are not benchmark measurements.
- Native monthly usage priced at the cited provider list prices; listed target allowances apply where present, excluding invoice credits, taxes and negotiated discounts. Rates as of 2026-10-22: us-east-1 → us-ashburn-1, USD/month.
- Source prices are reference charges, not an invoice. Target lines cover selected service usage/configuration only; adapter hosting and Tensor9 fees are excluded.
- Samples of explicit prices are not performance measurements or capacity qualification. No interpolation or break-even guarantee is implied.
- Variant assumptions show the first axis sample; any axis-dependent configuration is described by this curve’s workload note.
- Rates are cited provider list prices, editable for discounts, commitments or another region. Workload translation and capacity coefficients remain editable planning assumptions, not benchmark measurements or a commercial quote.
- Default-zero rates are explicit assumptions, not evidence that the deployed service or resource is free.
- Provisioned-unit minimums use an editable approximate allocation floor. Modeled target service cost is max(usage/allocation, minimum), with billable network, durable staging and dependent sinks added separately; actual RU/TU sizing, scaling increments and throughput remain unqualified.
- Durable staging is priced once: provisioned targets include adapter state in their selected allocation; native targets add a separate staging allocation when required. Adapter hosting is a separate allocation and must exclude resources already priced as staging, workers or target capacity.
- A declared adapter mapping and cost model do not establish implementation availability or service equivalence.
- This is a declared directed mapping; a planning estimate does not establish deployment or request-serving support.
- Native/deployment comparison scope: This mapping provisions native target-cloud permissions. Application authorization uses the target cloud’s identity system; requests do not pass through an IAM service adapter. The IAM-to-Cedar adapter has separate service levels.
- Origin unit prices are cited provider list prices. Retention, amplification, and capacity coefficients are authored planning guesses; they are editable, not measured capacity.
- Free source IAM APIs do not imply zero adapted compute/state cost. In-process Cedar decisions are not separately billed cloud IAM decisions.
- Native policy translation does not create paid Entra seats or premium identity licenses automatically. Those licensed users require explicit separate quantities.
- Identity and access management APIs are free. Durable adapter state and hosting remain independent costs. OCI bills only identity-domain premium or external users, SMS and tokens above 10,000 a month, none of which this family uses.
- Row-store throughput (capacityOpsPerVcpuSecond, default 1500) is measured-by-tensor9 as a lower bound: the DynamoDB adapter on Cloud SQL db-custom-2-7680 (2 vCPU, PostgreSQL 16, us-west1) served 2,974 ops/s of YCSB-A at 16 threads without recorded saturation (src/main/kotlin/t9/prime/equiv/generated/eval/CloudsqlPostgresqlYcsbAT16GoYcsbV1_0_0.kt). Published CPU-bound pgbench reaches 3,101 read-write transactions and 20,289 point reads per vCPU-second (AWS z1d.2xlarge, PostgreSQL 14.5), so actual capacity is likely higher. Reads and writes share one coefficient: at the same adapter version, read-only YCSB-C was not faster than 50%-update YCSB-A.
- Log-broker throughput (capacityStreamMiBPerVcpuSecond 20 at 0.5 utilization, 4 GiB RAM per vCPU) is provider-documented by Google Managed Service for Apache Kafka sizing (https://docs.cloud.google.com/managed-service-for-apache-kafka/docs/plan-cluster-size): write-equivalent bytes are replicated writes plus a quarter of reads. Producer batches below 10 KB lower per-CPU throughput; that penalty is not modeled.
- Disk utilization 0.8 is provider-documented headroom below Cloud SQL automatic storage increase, which triggers near 91-95% full (https://docs.cloud.google.com/sql/docs/postgres/instance-settings). The 20 GiB reserve exceeds PostgreSQL’s 1 GB default max_wal_size; the remainder of that reserve is unmeasured.
- CPU tiers double from 2 vCPUs to the target’s largest node at 4 GiB per vCPU; each target’s documented largest node bounds CPU, RAM, RAM per vCPU and disk, and the durable staging database uses Cloud SQL Enterprise (96 vCPU, 6.5 GiB per vCPU, 624 GiB, 64 TiB). Targets billed per capacity unit or throughput unit are sized by their backend instead.
- No public evidence: peak/mean work (2) and the RAM working-set fraction (0.1). Proposed measurements: the p99 one-minute rate over the monthly mean from customer CloudWatch metrics; the buffer hit ratio while stepping RAM under a fixed YCSB-B load.
- Node bounds: Cloud SQL Enterprise allows 1-96 vCPUs at 0.9-6.5 GB per vCPU and up to 64 TB with a dedicated vCPU (https://docs.cloud.google.com/sql/docs/postgres/instance-settings).
- Stored GiB already includes the origin family’s physical footprint assumptions; no second storage amplification is applied.
- The operations/vCPU coefficient supplies the compute requirement alongside explicit resource-hour minima.
- Copies and allocation fractions change cost only; they do not increase modeled primary capacity.
- AWS IAM User Guide: What is IAM: https://docs.aws.amazon.com/IAM/latest/UserGuide/introduction.html
- OCI price list: https://www.oracle.com/cloud/price-list/
- Free allowances, committed discounts, credits, taxes and negotiated rates.
- Commercial Tensor9 fees and operations labor unless entered separately.
- Premium identity licenses, external federation providers, directory synchronization and all protected resource-service charges.
- Taxes, discounts, credits and free-tier allowances not explicitly listed by this model.
- Unmodeled dependent services, task execution and operations outside the selected workload family.
plan-9efbb4ad5b81bf0caeda01c49cfdf2dd9b017b71 / 2026-10-22.planning.2. Curve: workload-1.
Sources: AWS IAM User Guide: What is IAM, OCI price list.
AWS IAM and STS · IAM / STS management requests
Feature: AWS IAM and STS. Estimated monthly service charges by IAM / STS management requests. Adapter hosting and Tensor9 fees are excluded. Source: us-east-1; target: us-ashburn-1; currency: USD.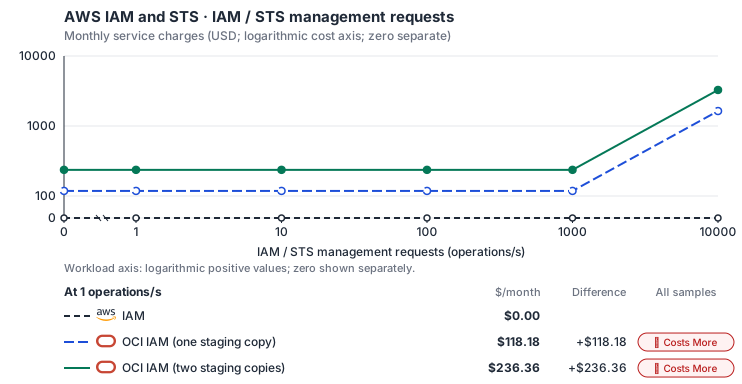
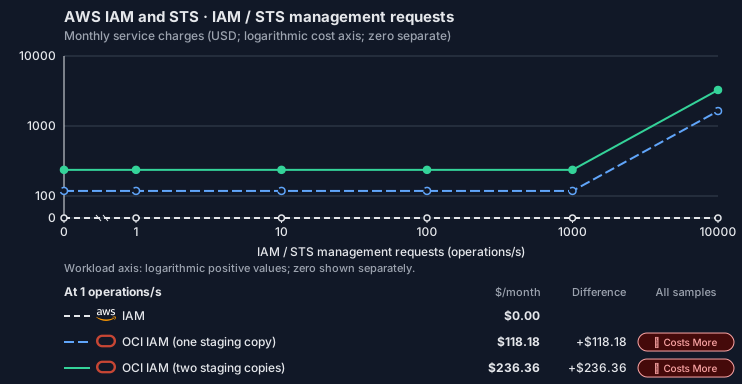
Estimated allocation, not benchmark calibrated: sized from 2 vCPU, 8 GiB memory and 100 GiB SSD at 0 operations/s to 32 vCPU, 128 GiB memory and 100 GiB SSD at 10,000 operations/s.
Curve assumptions
- Monthly operation quantity varies with this steady average rate; stored inventory and other meters retain their defaults. Other native meters and workload assumptions retain their explicitly displayed default quantities. Workload translation and capacity assumptions are not benchmark measurements.
- Native monthly usage priced at the cited provider list prices; listed target allowances apply where present, excluding invoice credits, taxes and negotiated discounts. Rates as of 2026-10-22: us-east-1 → us-ashburn-1, USD/month.
- Source prices are reference charges, not an invoice. Target lines cover selected service usage/configuration only; adapter hosting and Tensor9 fees are excluded.
- Samples of explicit prices are not performance measurements or capacity qualification. No interpolation or break-even guarantee is implied.
- Variant assumptions show the first axis sample; any axis-dependent configuration is described by this curve’s workload note.
- Rates are cited provider list prices, editable for discounts, commitments or another region. Workload translation and capacity coefficients remain editable planning assumptions, not benchmark measurements or a commercial quote.
- Default-zero rates are explicit assumptions, not evidence that the deployed service or resource is free.
- Provisioned-unit minimums use an editable approximate allocation floor. Modeled target service cost is max(usage/allocation, minimum), with billable network, durable staging and dependent sinks added separately; actual RU/TU sizing, scaling increments and throughput remain unqualified.
- Durable staging is priced once: provisioned targets include adapter state in their selected allocation; native targets add a separate staging allocation when required. Adapter hosting is a separate allocation and must exclude resources already priced as staging, workers or target capacity.
- A declared adapter mapping and cost model do not establish implementation availability or service equivalence.
- This is a declared directed mapping; a planning estimate does not establish deployment or request-serving support.
- Native/deployment comparison scope: This mapping provisions native target-cloud permissions. Application authorization uses the target cloud’s identity system; requests do not pass through an IAM service adapter. The IAM-to-Cedar adapter has separate service levels.
- Origin unit prices are cited provider list prices. Retention, amplification, and capacity coefficients are authored planning guesses; they are editable, not measured capacity.
- Free source IAM APIs do not imply zero adapted compute/state cost. In-process Cedar decisions are not separately billed cloud IAM decisions.
- Native policy translation does not create paid Entra seats or premium identity licenses automatically. Those licensed users require explicit separate quantities.
- Identity and access management APIs are free. Durable adapter state and hosting remain independent costs. OCI bills only identity-domain premium or external users, SMS and tokens above 10,000 a month, none of which this family uses.
- Row-store throughput (capacityOpsPerVcpuSecond, default 1500) is measured-by-tensor9 as a lower bound: the DynamoDB adapter on Cloud SQL db-custom-2-7680 (2 vCPU, PostgreSQL 16, us-west1) served 2,974 ops/s of YCSB-A at 16 threads without recorded saturation (src/main/kotlin/t9/prime/equiv/generated/eval/CloudsqlPostgresqlYcsbAT16GoYcsbV1_0_0.kt). Published CPU-bound pgbench reaches 3,101 read-write transactions and 20,289 point reads per vCPU-second (AWS z1d.2xlarge, PostgreSQL 14.5), so actual capacity is likely higher. Reads and writes share one coefficient: at the same adapter version, read-only YCSB-C was not faster than 50%-update YCSB-A.
- Log-broker throughput (capacityStreamMiBPerVcpuSecond 20 at 0.5 utilization, 4 GiB RAM per vCPU) is provider-documented by Google Managed Service for Apache Kafka sizing (https://docs.cloud.google.com/managed-service-for-apache-kafka/docs/plan-cluster-size): write-equivalent bytes are replicated writes plus a quarter of reads. Producer batches below 10 KB lower per-CPU throughput; that penalty is not modeled.
- Disk utilization 0.8 is provider-documented headroom below Cloud SQL automatic storage increase, which triggers near 91-95% full (https://docs.cloud.google.com/sql/docs/postgres/instance-settings). The 20 GiB reserve exceeds PostgreSQL’s 1 GB default max_wal_size; the remainder of that reserve is unmeasured.
- CPU tiers double from 2 vCPUs to the target’s largest node at 4 GiB per vCPU; each target’s documented largest node bounds CPU, RAM, RAM per vCPU and disk, and the durable staging database uses Cloud SQL Enterprise (96 vCPU, 6.5 GiB per vCPU, 624 GiB, 64 TiB). Targets billed per capacity unit or throughput unit are sized by their backend instead.
- No public evidence: peak/mean work (2) and the RAM working-set fraction (0.1). Proposed measurements: the p99 one-minute rate over the monthly mean from customer CloudWatch metrics; the buffer hit ratio while stepping RAM under a fixed YCSB-B load.
- Node bounds: Cloud SQL Enterprise allows 1-96 vCPUs at 0.9-6.5 GB per vCPU and up to 64 TB with a dedicated vCPU (https://docs.cloud.google.com/sql/docs/postgres/instance-settings).
- Stored GiB already includes the origin family’s physical footprint assumptions; no second storage amplification is applied.
- The operations/vCPU coefficient supplies the compute requirement alongside explicit resource-hour minima.
- Copies and allocation fractions change cost only; they do not increase modeled primary capacity.
- AWS IAM User Guide: What is IAM: https://docs.aws.amazon.com/IAM/latest/UserGuide/introduction.html
- OCI price list: https://www.oracle.com/cloud/price-list/
- Free allowances, committed discounts, credits, taxes and negotiated rates.
- Commercial Tensor9 fees and operations labor unless entered separately.
- Premium identity licenses, external federation providers, directory synchronization and all protected resource-service charges.
- Taxes, discounts, credits and free-tier allowances not explicitly listed by this model.
- Unmodeled dependent services, task execution and operations outside the selected workload family.
plan-9efbb4ad5b81bf0caeda01c49cfdf2dd9b017b71 / 2026-10-22.planning.2. Curve: workload-2.
Sources: AWS IAM User Guide: What is IAM, OCI price list.
See the service catalog for operation coverage, supported directions and backend limitations.