

- Coverage by target cloud
- How the backends compare
- On Google Cloud
- On Google Cloud and Private Kubernetes
- On Azure
- On OCI
- Costs
- Service level agreements
- Debug this service
Coverage by target cloud
How the backends compare
Each row compares a capability of Kinesis Data Firehose with its adaptation on each backend. A dash means this row is not stated for that backend.Max adaptation
On Google Cloud
Via Pub/Sub
How it works
Your application keeps sendingPutRecord and PutRecordBatch requests, now to the Tensor9 adapter. The adapter buffers accepted records on Google Cloud Pub/Sub, and a delivery worker sends batches to the destination, Google Cloud Storage. A successful call means the records were accepted into the buffer, not that the destination received them. When a batch has both successful and failed records, check each record’s result.
Size and interval settings decide when a batch is ready. A quiet stream may wait for the interval, and a busy one may reach the size first. Worker scheduling, optional transformation and the destination’s response time also add delay, so the buffering interval is not an end-to-end latency guarantee.
Transformation and destinations
The intended delivery path can run a batch through the selected Lambda adapter before it is written. JSON-to-Parquet conversion uses a default or inferred schema, not the declared Glue table schema; check the field types and the resulting files with the tools that read them. HTTP, search and SaaS destinations need their own credentials, reachable endpoints and delivery formats. A warehouse destination delivers records to the selected warehouse; you configure its tables and load format.Limitations
- Glue table schemas for Parquet conversion are not supported. Conversion uses a default or inferred schema. - Moving a Redshift warehouse is not supported. The database, schema, SQL queries and warehouse workload stay where they are. - Retries behave differently: they can repeat records. A destination can accept a batch before the worker records success, so a retry can repeat records or create a duplicate object. Downstream processing should detect duplicates. - Buffered AWS records are not moved. Records still buffered in the old AWS stream are not copied into the new buffer.
Other considerations
Before switching producers. Set up destination storage, credentials and any transformation first, and let the old AWS stream finish delivering its buffered records. Test the destination with representative batches, including failures and retries. What to monitor. Watch pending work, retry failures and destination delivery rather than successfulPutRecord calls. Measure delivery delay and sustained throughput with your actual transform, batch settings and destination.
Example monthly charges
This Tensor9 BYOC scenario estimates service charges for the named origin and target services. Adapter hosting and commercial Tensor9 fees need separate allocations. How Tensor9 estimates costs explains the method and what the estimates include.Data Firehose · Billed ingestion
Feature: Data Firehose. Estimated monthly service charges by Billed ingestion. Adapter hosting and Tensor9 fees are excluded. Source: us-east-1; target: us-central1; currency: USD.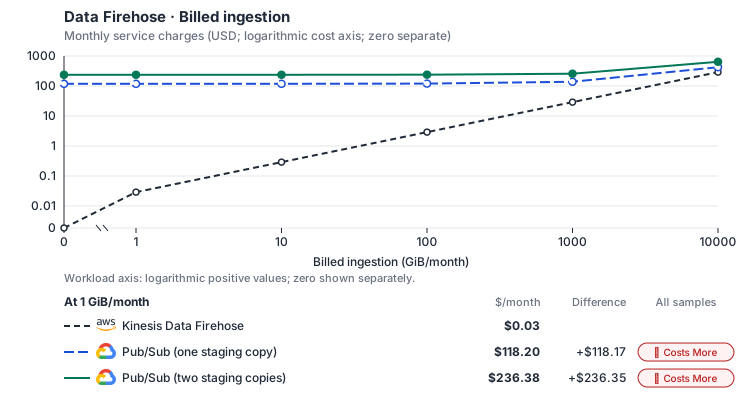
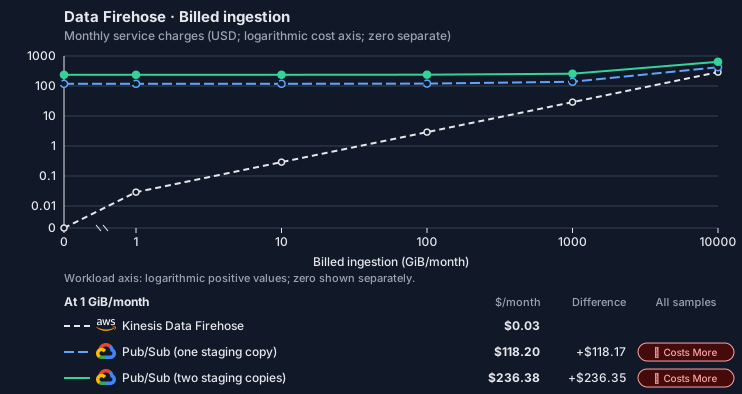
Estimated allocation, not benchmark calibrated: sized from 2 vCPU, 8 GiB memory and 100 GiB SSD at 0 GiB/month to 4 vCPU, 16 GiB memory and 100 GiB SSD at 10,000 GiB/month.
Curve assumptions
- Billed GiB includes per-record rounding; physical bytes can be much lower for small records. Other native meters and workload assumptions retain their explicitly displayed default quantities. Workload translation and capacity assumptions are not benchmark measurements.
- Native monthly usage priced at the cited provider list prices; listed target allowances apply where present, excluding invoice credits, taxes and negotiated discounts. Rates as of 2026-10-22: us-east-1 → us-central1, USD/month.
- Source prices are reference charges, not an invoice. Target lines cover selected service usage/configuration only; adapter hosting and Tensor9 fees are excluded.
- Samples of explicit prices are not performance measurements or capacity qualification. No interpolation or break-even guarantee is implied.
- Variant assumptions show the first axis sample; any axis-dependent configuration is described by this curve’s workload note.
- Rates are cited provider list prices, editable for discounts, commitments or another region. Workload translation and capacity coefficients remain editable planning assumptions, not benchmark measurements or a commercial quote.
- Default-zero rates are explicit assumptions, not evidence that the deployed service or resource is free.
- Provisioned-unit minimums use an editable approximate allocation floor. Modeled target service cost is max(usage/allocation, minimum), with billable network, durable staging and dependent sinks added separately; actual RU/TU sizing, scaling increments and throughput remain unqualified.
- Durable staging is priced once: provisioned targets include adapter state in their selected allocation; native targets add a separate staging allocation when required. Adapter hosting is a separate allocation and must exclude resources already priced as staging, workers or target capacity.
- A declared adapter mapping and cost model do not establish implementation availability or service equivalence.
- This is a declared directed mapping; a planning estimate does not establish deployment or request-serving support.
- Authored planning assumptions, not measured adapter capacity. Origin rates are cited first-tier list prices, before free allowances and discounts.
- A cost scenario does not establish backend availability, protocol fidelity or production readiness. Registry serving status remains independent.
- The landing buffer, durable staging, delivery workers and object sink are separate allocations. Primary stored GiB is retained landing payload; staging adds delivery metadata.
- Object sink retention and PUTs are priced separately from the landing backend. Even an object-store landing target needs the explicitly modeled temporary buffer allocation.
- These retention and sink-write assumptions are provisional; a broker-only subtotal does not price the complete pipeline.
- Google Pub/Sub bills published and delivered bytes at the Message Delivery Basic rate and retained messages per GiB-month. Each request is billed at no less than 1,000 bytes; the family’s batching and delivery assumptions must represent that. The first 10 GiB of combined throughput a month is free per billing account and is not applied. BigQuery and Cloud Storage subscriptions bill USD 50 per TiB instead. Unacknowledged messages younger than one day bill no storage.
- Row-store throughput (capacityOpsPerVcpuSecond, default 1500) is measured-by-tensor9 as a lower bound: the DynamoDB adapter on Cloud SQL db-custom-2-7680 (2 vCPU, PostgreSQL 16, us-west1) served 2,974 ops/s of YCSB-A at 16 threads without recorded saturation (src/main/kotlin/t9/prime/equiv/generated/eval/CloudsqlPostgresqlYcsbAT16GoYcsbV1_0_0.kt). Published CPU-bound pgbench reaches 3,101 read-write transactions and 20,289 point reads per vCPU-second (AWS z1d.2xlarge, PostgreSQL 14.5), so actual capacity is likely higher. Reads and writes share one coefficient: at the same adapter version, read-only YCSB-C was not faster than 50%-update YCSB-A.
- Log-broker throughput (capacityStreamMiBPerVcpuSecond 20 at 0.5 utilization, 4 GiB RAM per vCPU) is provider-documented by Google Managed Service for Apache Kafka sizing (https://docs.cloud.google.com/managed-service-for-apache-kafka/docs/plan-cluster-size): write-equivalent bytes are replicated writes plus a quarter of reads. Producer batches below 10 KB lower per-CPU throughput; that penalty is not modeled.
- Disk utilization 0.8 is provider-documented headroom below Cloud SQL automatic storage increase, which triggers near 91-95% full (https://docs.cloud.google.com/sql/docs/postgres/instance-settings). The 20 GiB reserve exceeds PostgreSQL’s 1 GB default max_wal_size; the remainder of that reserve is unmeasured.
- CPU tiers double from 2 vCPUs to the target’s largest node at 4 GiB per vCPU; each target’s documented largest node bounds CPU, RAM, RAM per vCPU and disk, and the durable staging database uses Cloud SQL Enterprise (96 vCPU, 6.5 GiB per vCPU, 624 GiB, 64 TiB). Targets billed per capacity unit or throughput unit are sized by their backend instead.
- No public evidence: peak/mean work (2) and the RAM working-set fraction (0.1). Proposed measurements: the p99 one-minute rate over the monthly mean from customer CloudWatch metrics; the buffer hit ratio while stepping RAM under a fixed YCSB-B load.
- Node bounds: Cloud SQL Enterprise allows 1-96 vCPUs at 0.9-6.5 GB per vCPU and up to 64 TB with a dedicated vCPU (https://docs.cloud.google.com/sql/docs/postgres/instance-settings).
- Stored GiB already includes the origin family’s physical footprint assumptions; no second storage amplification is applied.
- The operations/vCPU coefficient supplies the compute requirement alongside explicit resource-hour minima.
- Copies and allocation fractions change cost only; they do not increase modeled primary capacity.
- AWS Price List API, AmazonKinesisFirehose offer: https://pricing.us-east-1.amazonaws.com/offers/v1.0/aws/AmazonKinesisFirehose/current/us-east-1/index.json
- Pub/Sub pricing: https://cloud.google.com/pubsub/pricing
- Additional network transfer, backups, KMS, one-time migration and operational labor unless an explicit meter includes them.
- Destination application execution and separately billed downstream services; supply those allocations separately.
- Dynamic partitioning, format conversion, VPC delivery and origin sink charges; transformation-specific compute.
- Taxes, discounts, credits and free-tier allowances not explicitly listed by this model.
- Unmodeled dependent services, task execution and operations outside the selected workload family.
plan-8e313c75fd8bde1c00ef6902b0b9b1fc60233239 / 2026-10-22.planning.2. Curve: workload-1.
Sources: AWS Price List API, AmazonKinesisFirehose offer, Pub/Sub pricing.
Data Firehose → Pub/Sub: Authored native-usage planning example. Native monthly usage priced at the cited provider list prices; listed target allowances apply where present, excluding invoice credits, taxes and negotiated discounts.
Scenario source region: us-east-1. Scenario target region: us-central1. Currency: USD.
Estimated allocation, not benchmark calibrated: sized at 2 vCPU, 8 GiB memory and 100 GiB SSD for this scenario.
Unestimated components: Adapter hosting, Tensor9 fees. A modeled adapted total and savings require these costs.
Cost scope: Modeled target native service and explicitly modeled state allocation; hosting and Tensor9 fees only when supplied.
Excluded costs and workload features:
- Additional network transfer, backups, KMS, one-time migration and operational labor unless an explicit meter includes them.
- Destination application execution and separately billed downstream services; supply those allocations separately.
- Dynamic partitioning, format conversion, VPC delivery and origin sink charges; transformation-specific compute.
- Taxes, discounts, credits and free-tier allowances not explicitly listed by this model.
- Unmodeled dependent services, task execution and operations outside the selected workload family.
- Translated reads: 0 operations.
- Translated writes: 0 operations.
- Translated resident physical data: 0 GiB-month.
- Native provider operations: 0 operations.
- Published payload: 0 GiB.
- Delivered payload: 0 GiB.
- Allocated execution CPU: 0 vCPU-hour.
- Allocated execution RAM: 0 GiB-hour.
- Independent resource allocation: 0 resource-hour.
- Independent inventory: 0 resource-month.
- Input tokens: 0 tokens.
- Output tokens: 0 tokens.
- Billable network: 0 GiB.
- Dependent object sink retained data: 0 GiB-month.
- Dependent object sink writes: 0 writes.
- Explicit durable staging footprint: 0 GiB-month.
- Rates are cited provider list prices, editable for discounts, commitments or another region. Workload translation and capacity coefficients remain editable planning assumptions, not benchmark measurements or a commercial quote.
- Default-zero rates are explicit assumptions, not evidence that the deployed service or resource is free.
- Provisioned-unit minimums use an editable approximate allocation floor. Modeled target service cost is max(usage/allocation, minimum), with billable network, durable staging and dependent sinks added separately; actual RU/TU sizing, scaling increments and throughput remain unqualified.
- Durable staging is priced once: provisioned targets include adapter state in their selected allocation; native targets add a separate staging allocation when required. Adapter hosting is a separate allocation and must exclude resources already priced as staging, workers or target capacity.
- A declared adapter mapping and cost model do not establish implementation availability or service equivalence.
- This is a declared directed mapping; a planning estimate does not establish deployment or request-serving support.
- Authored planning assumptions, not measured adapter capacity. Origin rates are cited first-tier list prices, before free allowances and discounts.
- A cost scenario does not establish backend availability, protocol fidelity or production readiness. Registry serving status remains independent.
- The landing buffer, durable staging, delivery workers and object sink are separate allocations. Primary stored GiB is retained landing payload; staging adds delivery metadata.
- Object sink retention and PUTs are priced separately from the landing backend. Even an object-store landing target needs the explicitly modeled temporary buffer allocation.
- These retention and sink-write assumptions are provisional; a broker-only subtotal does not price the complete pipeline.
- Google Pub/Sub bills published and delivered bytes at the Message Delivery Basic rate and retained messages per GiB-month. Each request is billed at no less than 1,000 bytes; the family’s batching and delivery assumptions must represent that. The first 10 GiB of combined throughput a month is free per billing account and is not applied. BigQuery and Cloud Storage subscriptions bill USD 50 per TiB instead. Unacknowledged messages younger than one day bill no storage.
- Row-store throughput (capacityOpsPerVcpuSecond, default 1500) is measured-by-tensor9 as a lower bound: the DynamoDB adapter on Cloud SQL db-custom-2-7680 (2 vCPU, PostgreSQL 16, us-west1) served 2,974 ops/s of YCSB-A at 16 threads without recorded saturation (src/main/kotlin/t9/prime/equiv/generated/eval/CloudsqlPostgresqlYcsbAT16GoYcsbV1_0_0.kt). Published CPU-bound pgbench reaches 3,101 read-write transactions and 20,289 point reads per vCPU-second (AWS z1d.2xlarge, PostgreSQL 14.5), so actual capacity is likely higher. Reads and writes share one coefficient: at the same adapter version, read-only YCSB-C was not faster than 50%-update YCSB-A.
- Log-broker throughput (capacityStreamMiBPerVcpuSecond 20 at 0.5 utilization, 4 GiB RAM per vCPU) is provider-documented by Google Managed Service for Apache Kafka sizing (https://docs.cloud.google.com/managed-service-for-apache-kafka/docs/plan-cluster-size): write-equivalent bytes are replicated writes plus a quarter of reads. Producer batches below 10 KB lower per-CPU throughput; that penalty is not modeled.
- Disk utilization 0.8 is provider-documented headroom below Cloud SQL automatic storage increase, which triggers near 91-95% full (https://docs.cloud.google.com/sql/docs/postgres/instance-settings). The 20 GiB reserve exceeds PostgreSQL’s 1 GB default max_wal_size; the remainder of that reserve is unmeasured.
- CPU tiers double from 2 vCPUs to the target’s largest node at 4 GiB per vCPU; each target’s documented largest node bounds CPU, RAM, RAM per vCPU and disk, and the durable staging database uses Cloud SQL Enterprise (96 vCPU, 6.5 GiB per vCPU, 624 GiB, 64 TiB). Targets billed per capacity unit or throughput unit are sized by their backend instead.
- No public evidence: peak/mean work (2) and the RAM working-set fraction (0.1). Proposed measurements: the p99 one-minute rate over the monthly mean from customer CloudWatch metrics; the buffer hit ratio while stepping RAM under a fixed YCSB-B load.
- Node bounds: Cloud SQL Enterprise allows 1-96 vCPUs at 0.9-6.5 GB per vCPU and up to 64 TB with a dedicated vCPU (https://docs.cloud.google.com/sql/docs/postgres/instance-settings).
- Stored GiB already includes the origin family’s physical footprint assumptions; no second storage amplification is applied.
- The operations/vCPU coefficient supplies the compute requirement alongside explicit resource-hour minima.
- Copies and allocation fractions change cost only; they do not increase modeled primary capacity.
plan-8e313c75fd8bde1c00ef6902b0b9b1fc60233239 / 2026-10-22.planning.2. Scenario: planning-example.
Sources: AWS Price List API, AmazonKinesisFirehose offer, Pub/Sub pricing.
On Google Cloud and Private Kubernetes
Via Strimzi Kafka
How it works
Your application keeps sendingPutRecord and PutRecordBatch requests, now to the Tensor9 adapter. The adapter buffers accepted records on Apache Kafka (Strimzi) on the target cluster, and a delivery worker sends batches to the destination, the appliance object store (MinIO). A successful call means the records were accepted into the buffer, not that the destination received them. When a batch has both successful and failed records, check each record’s result.
Size and interval settings decide when a batch is ready. A quiet stream may wait for the interval, and a busy one may reach the size first. Worker scheduling, optional transformation and the destination’s response time also add delay, so the buffering interval is not an end-to-end latency guarantee.
Transformation and destinations
The intended delivery path can run a batch through the selected Lambda adapter before it is written. JSON-to-Parquet conversion uses a default or inferred schema, not the declared Glue table schema; check the field types and the resulting files with the tools that read them. HTTP, search and SaaS destinations need their own credentials, reachable endpoints and delivery formats. A warehouse destination delivers records to the selected warehouse; you configure its tables and load format.Limitations
- Glue table schemas for Parquet conversion are not supported. Conversion uses a default or inferred schema. - Moving a Redshift warehouse is not supported. The database, schema, SQL queries and warehouse workload stay where they are. - Retries behave differently: they can repeat records. A destination can accept a batch before the worker records success, so a retry can repeat records or create a duplicate object. Downstream processing should detect duplicates. - Buffered AWS records are not moved. Records still buffered in the old AWS stream are not copied into the new buffer.
Other considerations
Before switching producers. Set up destination storage, credentials and any transformation first, and let the old AWS stream finish delivering its buffered records. Test the destination with representative batches, including failures and retries. What to monitor. Watch pending work, retry failures and destination delivery rather than successfulPutRecord calls. Measure delivery delay and sustained throughput with your actual transform, batch settings and destination.
Example monthly charges
This Tensor9 BYOC scenario estimates service charges for the named origin and target services. Adapter hosting and commercial Tensor9 fees need separate allocations. How Tensor9 estimates costs explains the method and what the estimates include.Data Firehose · Billed ingestion
Feature: Data Firehose. Estimated monthly service charges by Billed ingestion. Adapter hosting and Tensor9 fees are excluded. Source: us-east-1; target: us-central1; currency: USD.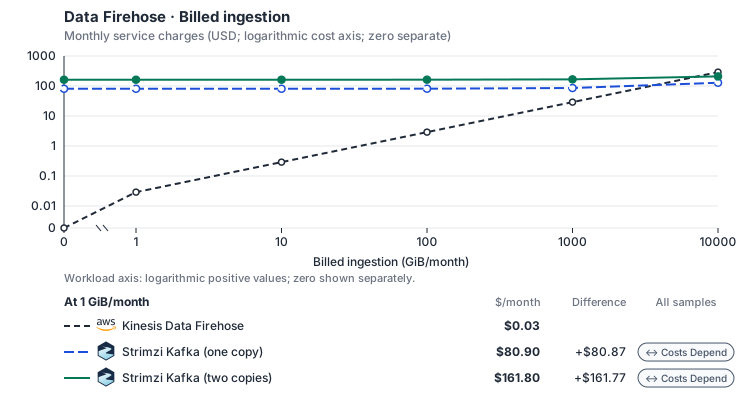
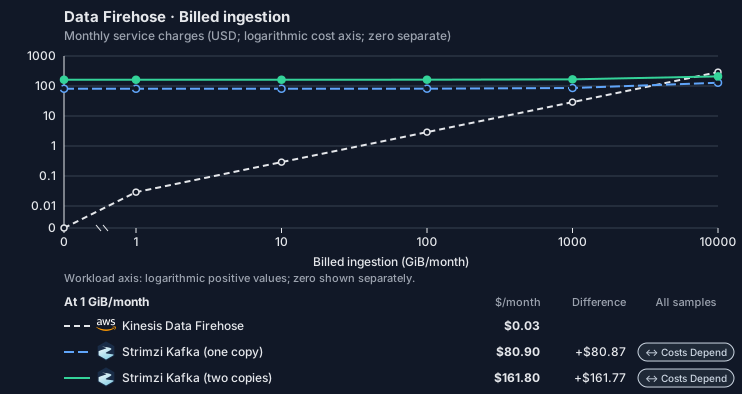
Estimated allocation, not benchmark calibrated: sized at 2 vCPU, 8 GiB memory and 100 GiB SSD at every sample.
Curve assumptions
- Billed GiB includes per-record rounding; physical bytes can be much lower for small records. Other native meters and workload assumptions retain their explicitly displayed default quantities. Workload translation and capacity assumptions are not benchmark measurements.
- Native monthly usage priced at the cited provider list prices; listed target allowances apply where present, excluding invoice credits, taxes and negotiated discounts. Rates as of 2026-10-22: us-east-1 → us-central1, USD/month.
- Source prices are reference charges, not an invoice. Target lines cover selected service usage/configuration only; adapter hosting and Tensor9 fees are excluded.
- Samples of explicit prices are not performance measurements or capacity qualification. No interpolation or break-even guarantee is implied.
- Variant assumptions show the first axis sample; any axis-dependent configuration is described by this curve’s workload note.
- Rates are cited provider list prices, editable for discounts, commitments or another region. Workload translation and capacity coefficients remain editable planning assumptions, not benchmark measurements or a commercial quote.
- Default-zero rates are explicit assumptions, not evidence that the deployed service or resource is free.
- Provisioned-unit minimums use an editable approximate allocation floor. Modeled target service cost is max(usage/allocation, minimum), with billable network, durable staging and dependent sinks added separately; actual RU/TU sizing, scaling increments and throughput remain unqualified.
- Durable staging is priced once: provisioned targets include adapter state in their selected allocation; native targets add a separate staging allocation when required. Adapter hosting is a separate allocation and must exclude resources already priced as staging, workers or target capacity.
- A declared adapter mapping and cost model do not establish implementation availability or service equivalence.
- This is a declared directed mapping; a planning estimate does not establish deployment or request-serving support.
- Authored planning assumptions, not measured adapter capacity. Origin rates are cited first-tier list prices, before free allowances and discounts.
- A cost scenario does not establish backend availability, protocol fidelity or production readiness. Registry serving status remains independent.
- The landing buffer, durable staging, delivery workers and object sink are separate allocations. Primary stored GiB is retained landing payload; staging adds delivery metadata.
- Object sink retention and PUTs are priced separately from the landing backend. Even an object-store landing target needs the explicitly modeled temporary buffer allocation.
- These retention and sink-write assumptions are provisional; a broker-only subtotal does not price the complete pipeline.
- Self-hosted target: Strimzi and Apache Kafka (Apache-2.0, https://github.com/strimzi/strimzi-kafka-operator/blob/main/LICENSE); Kafka replication multiplies disk beyond the copies this model bills. Selected CPU, RAM and physical disk allocation grow with workload; no per-operation price is assumed. No vendor charge: the target runs on the customer’s Kubernetes nodes, so CPU, RAM and disk bill at the Kubernetes node reference rates, Compute Engine N2 in us-central1 (USD 0.031611/vCPU-hour, 0.004237/GiB-hour) with pd-balanced disk (0.10/GiB-month) and Premium Tier egress. The cost-optimized E2 series lists 0.02181159/vCPU-hour and 0.00292353/GiB-hour; AWS m6i/r6i and Azure D2s v5/E2s v5 both decompose to 0.033/vCPU-hour and 0.00375/GiB-hour. Requested CPU and RAM are billed; node bin-packing waste, system reservations and the cluster control-plane fee are not.
- Row-store throughput (capacityOpsPerVcpuSecond, default 1500) is measured-by-tensor9 as a lower bound: the DynamoDB adapter on Cloud SQL db-custom-2-7680 (2 vCPU, PostgreSQL 16, us-west1) served 2,974 ops/s of YCSB-A at 16 threads without recorded saturation (src/main/kotlin/t9/prime/equiv/generated/eval/CloudsqlPostgresqlYcsbAT16GoYcsbV1_0_0.kt). Published CPU-bound pgbench reaches 3,101 read-write transactions and 20,289 point reads per vCPU-second (AWS z1d.2xlarge, PostgreSQL 14.5), so actual capacity is likely higher. Reads and writes share one coefficient: at the same adapter version, read-only YCSB-C was not faster than 50%-update YCSB-A.
- Log-broker throughput (capacityStreamMiBPerVcpuSecond 20 at 0.5 utilization, 4 GiB RAM per vCPU) is provider-documented by Google Managed Service for Apache Kafka sizing (https://docs.cloud.google.com/managed-service-for-apache-kafka/docs/plan-cluster-size): write-equivalent bytes are replicated writes plus a quarter of reads. Producer batches below 10 KB lower per-CPU throughput; that penalty is not modeled.
- Disk utilization 0.8 is provider-documented headroom below Cloud SQL automatic storage increase, which triggers near 91-95% full (https://docs.cloud.google.com/sql/docs/postgres/instance-settings). The 20 GiB reserve exceeds PostgreSQL’s 1 GB default max_wal_size; the remainder of that reserve is unmeasured.
- CPU tiers double from 2 vCPUs to the target’s largest node at 4 GiB per vCPU; each target’s documented largest node bounds CPU, RAM, RAM per vCPU and disk, and the durable staging database uses Cloud SQL Enterprise (96 vCPU, 6.5 GiB per vCPU, 624 GiB, 64 TiB). Targets billed per capacity unit or throughput unit are sized by their backend instead.
- No public evidence: peak/mean work (2) and the RAM working-set fraction (0.1). Proposed measurements: the p99 one-minute rate over the monthly mean from customer CloudWatch metrics; the buffer hit ratio while stepping RAM under a fixed YCSB-B load.
- Node bounds: Cloud SQL Enterprise allows 1-96 vCPUs at 0.9-6.5 GB per vCPU and up to 64 TB with a dedicated vCPU (https://docs.cloud.google.com/sql/docs/postgres/instance-settings).
- Stored GiB already includes the origin family’s physical footprint assumptions; no second storage amplification is applied.
- Broker CPU follows write-equivalent bytes; the row-store operations coefficient is not applied.
- Copies and allocation fractions change cost only; they do not increase modeled primary capacity.
- AWS Price List API, AmazonKinesisFirehose offer: https://pricing.us-east-1.amazonaws.com/offers/v1.0/aws/AmazonKinesisFirehose/current/us-east-1/index.json
- Compute Engine general-purpose machine pricing: https://cloud.google.com/products/compute/pricing/general-purpose
- Disk and image pricing: https://cloud.google.com/compute/disks-image-pricing
- Network pricing: https://cloud.google.com/vpc/network-pricing
- Additional network transfer, backups, KMS, one-time migration and operational labor unless an explicit meter includes them.
- Destination application execution and separately billed downstream services; supply those allocations separately.
- Dynamic partitioning, format conversion, VPC delivery and origin sink charges; transformation-specific compute.
- Taxes, discounts, credits and free-tier allowances not explicitly listed by this model.
- Unmodeled dependent services, task execution and operations outside the selected workload family.
plan-6c87f4e94978e5b55e2f427442b2d980d92de89e / 2026-10-22.planning.2. Curve: workload-1.
Sources: AWS Price List API, AmazonKinesisFirehose offer, Compute Engine general-purpose machine pricing, Disk and image pricing, Network pricing.
Data Firehose → Strimzi Kafka: Authored native-usage planning example. Native monthly usage priced at the cited provider list prices; listed target allowances apply where present, excluding invoice credits, taxes and negotiated discounts.
Scenario source region: us-east-1. Scenario target region: us-central1. Currency: USD.
Estimated allocation, not benchmark calibrated: sized at 2 vCPU, 8 GiB memory and 100 GiB SSD for this scenario.
Unestimated components: Adapter hosting, Tensor9 fees. A modeled adapted total and savings require these costs.
Cost scope: Modeled target native service and explicitly modeled state allocation; hosting and Tensor9 fees only when supplied.
Excluded costs and workload features:
- Additional network transfer, backups, KMS, one-time migration and operational labor unless an explicit meter includes them.
- Destination application execution and separately billed downstream services; supply those allocations separately.
- Dynamic partitioning, format conversion, VPC delivery and origin sink charges; transformation-specific compute.
- Taxes, discounts, credits and free-tier allowances not explicitly listed by this model.
- Unmodeled dependent services, task execution and operations outside the selected workload family.
- Translated reads: 0 operations.
- Translated writes: 0 operations.
- Translated resident physical data: 0 GiB-month.
- Native provider operations: 0 operations.
- Published payload: 0 GiB.
- Delivered payload: 0 GiB.
- Allocated execution CPU: 0 vCPU-hour.
- Allocated execution RAM: 0 GiB-hour.
- Independent resource allocation: 0 resource-hour.
- Independent inventory: 0 resource-month.
- Input tokens: 0 tokens.
- Output tokens: 0 tokens.
- Billable network: 0 GiB.
- Dependent object sink retained data: 0 GiB-month.
- Dependent object sink writes: 0 writes.
- Explicit durable staging footprint: 0 GiB-month.
- Rates are cited provider list prices, editable for discounts, commitments or another region. Workload translation and capacity coefficients remain editable planning assumptions, not benchmark measurements or a commercial quote.
- Default-zero rates are explicit assumptions, not evidence that the deployed service or resource is free.
- Provisioned-unit minimums use an editable approximate allocation floor. Modeled target service cost is max(usage/allocation, minimum), with billable network, durable staging and dependent sinks added separately; actual RU/TU sizing, scaling increments and throughput remain unqualified.
- Durable staging is priced once: provisioned targets include adapter state in their selected allocation; native targets add a separate staging allocation when required. Adapter hosting is a separate allocation and must exclude resources already priced as staging, workers or target capacity.
- A declared adapter mapping and cost model do not establish implementation availability or service equivalence.
- This is a declared directed mapping; a planning estimate does not establish deployment or request-serving support.
- Authored planning assumptions, not measured adapter capacity. Origin rates are cited first-tier list prices, before free allowances and discounts.
- A cost scenario does not establish backend availability, protocol fidelity or production readiness. Registry serving status remains independent.
- The landing buffer, durable staging, delivery workers and object sink are separate allocations. Primary stored GiB is retained landing payload; staging adds delivery metadata.
- Object sink retention and PUTs are priced separately from the landing backend. Even an object-store landing target needs the explicitly modeled temporary buffer allocation.
- These retention and sink-write assumptions are provisional; a broker-only subtotal does not price the complete pipeline.
- Self-hosted target: Strimzi and Apache Kafka (Apache-2.0, https://github.com/strimzi/strimzi-kafka-operator/blob/main/LICENSE); Kafka replication multiplies disk beyond the copies this model bills. Selected CPU, RAM and physical disk allocation grow with workload; no per-operation price is assumed. No vendor charge: the target runs on the customer’s Kubernetes nodes, so CPU, RAM and disk bill at the Kubernetes node reference rates, Compute Engine N2 in us-central1 (USD 0.031611/vCPU-hour, 0.004237/GiB-hour) with pd-balanced disk (0.10/GiB-month) and Premium Tier egress. The cost-optimized E2 series lists 0.02181159/vCPU-hour and 0.00292353/GiB-hour; AWS m6i/r6i and Azure D2s v5/E2s v5 both decompose to 0.033/vCPU-hour and 0.00375/GiB-hour. Requested CPU and RAM are billed; node bin-packing waste, system reservations and the cluster control-plane fee are not.
- Row-store throughput (capacityOpsPerVcpuSecond, default 1500) is measured-by-tensor9 as a lower bound: the DynamoDB adapter on Cloud SQL db-custom-2-7680 (2 vCPU, PostgreSQL 16, us-west1) served 2,974 ops/s of YCSB-A at 16 threads without recorded saturation (src/main/kotlin/t9/prime/equiv/generated/eval/CloudsqlPostgresqlYcsbAT16GoYcsbV1_0_0.kt). Published CPU-bound pgbench reaches 3,101 read-write transactions and 20,289 point reads per vCPU-second (AWS z1d.2xlarge, PostgreSQL 14.5), so actual capacity is likely higher. Reads and writes share one coefficient: at the same adapter version, read-only YCSB-C was not faster than 50%-update YCSB-A.
- Log-broker throughput (capacityStreamMiBPerVcpuSecond 20 at 0.5 utilization, 4 GiB RAM per vCPU) is provider-documented by Google Managed Service for Apache Kafka sizing (https://docs.cloud.google.com/managed-service-for-apache-kafka/docs/plan-cluster-size): write-equivalent bytes are replicated writes plus a quarter of reads. Producer batches below 10 KB lower per-CPU throughput; that penalty is not modeled.
- Disk utilization 0.8 is provider-documented headroom below Cloud SQL automatic storage increase, which triggers near 91-95% full (https://docs.cloud.google.com/sql/docs/postgres/instance-settings). The 20 GiB reserve exceeds PostgreSQL’s 1 GB default max_wal_size; the remainder of that reserve is unmeasured.
- CPU tiers double from 2 vCPUs to the target’s largest node at 4 GiB per vCPU; each target’s documented largest node bounds CPU, RAM, RAM per vCPU and disk, and the durable staging database uses Cloud SQL Enterprise (96 vCPU, 6.5 GiB per vCPU, 624 GiB, 64 TiB). Targets billed per capacity unit or throughput unit are sized by their backend instead.
- No public evidence: peak/mean work (2) and the RAM working-set fraction (0.1). Proposed measurements: the p99 one-minute rate over the monthly mean from customer CloudWatch metrics; the buffer hit ratio while stepping RAM under a fixed YCSB-B load.
- Node bounds: Cloud SQL Enterprise allows 1-96 vCPUs at 0.9-6.5 GB per vCPU and up to 64 TB with a dedicated vCPU (https://docs.cloud.google.com/sql/docs/postgres/instance-settings).
- Stored GiB already includes the origin family’s physical footprint assumptions; no second storage amplification is applied.
- Broker CPU follows write-equivalent bytes; the row-store operations coefficient is not applied.
- Copies and allocation fractions change cost only; they do not increase modeled primary capacity.
plan-6c87f4e94978e5b55e2f427442b2d980d92de89e / 2026-10-22.planning.2. Scenario: planning-example.
Sources: AWS Price List API, AmazonKinesisFirehose offer, Compute Engine general-purpose machine pricing, Disk and image pricing, Network pricing.
On Azure
How it works
Your application keeps sendingPutRecord and PutRecordBatch requests, now to the Tensor9 adapter. The adapter buffers accepted records on Azure Event Hubs, and a delivery worker sends batches to the destination, Azure Blob Storage. A successful call means the records were accepted into the buffer, not that the destination received them. When a batch has both successful and failed records, check each record’s result.
Size and interval settings decide when a batch is ready. A quiet stream may wait for the interval, and a busy one may reach the size first. Worker scheduling, optional transformation and the destination’s response time also add delay, so the buffering interval is not an end-to-end latency guarantee.
Transformation and destinations
The intended delivery path can run a batch through the selected Lambda adapter before it is written. JSON-to-Parquet conversion uses a default or inferred schema, not the declared Glue table schema; check the field types and the resulting files with the tools that read them. HTTP, search and SaaS destinations need their own credentials, reachable endpoints and delivery formats. A warehouse destination delivers records to the selected warehouse; you configure its tables and load format.Limitations
- Glue table schemas for Parquet conversion are not supported. Conversion uses a default or inferred schema. - Moving a Redshift warehouse is not supported. The database, schema, SQL queries and warehouse workload stay where they are. - Retries behave differently: they can repeat records. A destination can accept a batch before the worker records success, so a retry can repeat records or create a duplicate object. Downstream processing should detect duplicates. - Buffered AWS records are not moved. Records still buffered in the old AWS stream are not copied into the new buffer.
Other considerations
Before switching producers. Set up destination storage, credentials and any transformation first, and let the old AWS stream finish delivering its buffered records. Test the destination with representative batches, including failures and retries. What to monitor. Watch pending work, retry failures and destination delivery rather than successfulPutRecord calls. Measure delivery delay and sustained throughput with your actual transform, batch settings and destination.
Example monthly charges
This Tensor9 BYOC scenario estimates service charges for the named origin and target services. Adapter hosting and commercial Tensor9 fees need separate allocations. How Tensor9 estimates costs explains the method and what the estimates include.Data Firehose · Billed ingestion
Feature: Data Firehose. Estimated monthly service charges by Billed ingestion. Adapter hosting and Tensor9 fees are excluded. Source: us-east-1; target: East US; currency: USD.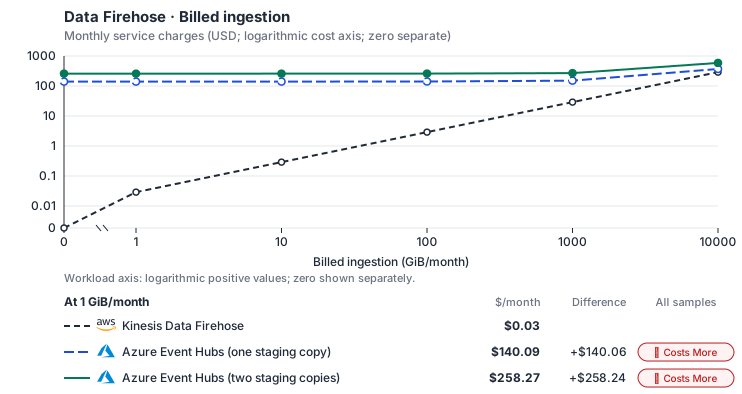
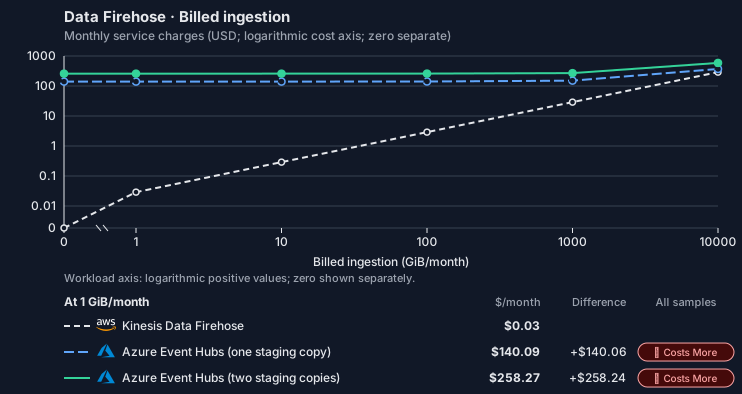
Estimated allocation, not benchmark calibrated: sized from 2 vCPU, 8 GiB memory and 100 GiB SSD at 0 GiB/month to 4 vCPU, 16 GiB memory and 100 GiB SSD at 10,000 GiB/month.
Curve assumptions
- Billed GiB includes per-record rounding; physical bytes can be much lower for small records. Other native meters and workload assumptions retain their explicitly displayed default quantities. Workload translation and capacity assumptions are not benchmark measurements.
- Native monthly usage priced at the cited provider list prices; listed target allowances apply where present, excluding invoice credits, taxes and negotiated discounts. Rates as of 2026-10-22: us-east-1 → East US, USD/month.
- Source prices are reference charges, not an invoice. Target lines cover selected service usage/configuration only; adapter hosting and Tensor9 fees are excluded.
- Samples of explicit prices are not performance measurements or capacity qualification. No interpolation or break-even guarantee is implied.
- Variant assumptions show the first axis sample; any axis-dependent configuration is described by this curve’s workload note.
- Rates are cited provider list prices, editable for discounts, commitments or another region. Workload translation and capacity coefficients remain editable planning assumptions, not benchmark measurements or a commercial quote.
- Default-zero rates are explicit assumptions, not evidence that the deployed service or resource is free.
- Provisioned-unit minimums use an editable approximate allocation floor. Modeled target service cost is max(usage/allocation, minimum), with billable network, durable staging and dependent sinks added separately; actual RU/TU sizing, scaling increments and throughput remain unqualified.
- Durable staging is priced once: provisioned targets include adapter state in their selected allocation; native targets add a separate staging allocation when required. Adapter hosting is a separate allocation and must exclude resources already priced as staging, workers or target capacity.
- A declared adapter mapping and cost model do not establish implementation availability or service equivalence.
- This is a declared directed mapping; a planning estimate does not establish deployment or request-serving support.
- Authored planning assumptions, not measured adapter capacity. Origin rates are cited first-tier list prices, before free allowances and discounts.
- A cost scenario does not establish backend availability, protocol fidelity or production readiness. Registry serving status remains independent.
- The landing buffer, durable staging, delivery workers and object sink are separate allocations. Primary stored GiB is retained landing payload; staging adds delivery metadata.
- Object sink retention and PUTs are priced separately from the landing backend. Even an object-store landing target needs the explicitly modeled temporary buffer allocation.
- These retention and sink-write assumptions are provisional; a broker-only subtotal does not price the complete pipeline.
- Azure Event Hubs Standard bills throughput-unit hours, sized here from the family’s published and delivered bytes and its ingress (write) and egress (read) event rates against one unit’s published limits, never below one unit (USD 21.90/month). Ingress events also bill USD 0.028 per million; each family write is one event, and events over 64 KB, which bill as several, are not split. Up to 84 GB of storage per unit is included, so retained data adds no charge. Capture, when enabled, bills USD 0.10 per throughput-unit hour and is not modeled.
- Row-store throughput (capacityOpsPerVcpuSecond, default 1500) is measured-by-tensor9 as a lower bound: the DynamoDB adapter on Cloud SQL db-custom-2-7680 (2 vCPU, PostgreSQL 16, us-west1) served 2,974 ops/s of YCSB-A at 16 threads without recorded saturation (src/main/kotlin/t9/prime/equiv/generated/eval/CloudsqlPostgresqlYcsbAT16GoYcsbV1_0_0.kt). Published CPU-bound pgbench reaches 3,101 read-write transactions and 20,289 point reads per vCPU-second (AWS z1d.2xlarge, PostgreSQL 14.5), so actual capacity is likely higher. Reads and writes share one coefficient: at the same adapter version, read-only YCSB-C was not faster than 50%-update YCSB-A.
- Log-broker throughput (capacityStreamMiBPerVcpuSecond 20 at 0.5 utilization, 4 GiB RAM per vCPU) is provider-documented by Google Managed Service for Apache Kafka sizing (https://docs.cloud.google.com/managed-service-for-apache-kafka/docs/plan-cluster-size): write-equivalent bytes are replicated writes plus a quarter of reads. Producer batches below 10 KB lower per-CPU throughput; that penalty is not modeled.
- Disk utilization 0.8 is provider-documented headroom below Cloud SQL automatic storage increase, which triggers near 91-95% full (https://docs.cloud.google.com/sql/docs/postgres/instance-settings). The 20 GiB reserve exceeds PostgreSQL’s 1 GB default max_wal_size; the remainder of that reserve is unmeasured.
- CPU tiers double from 2 vCPUs to the target’s largest node at 4 GiB per vCPU; each target’s documented largest node bounds CPU, RAM, RAM per vCPU and disk, and the durable staging database uses Cloud SQL Enterprise (96 vCPU, 6.5 GiB per vCPU, 624 GiB, 64 TiB). Targets billed per capacity unit or throughput unit are sized by their backend instead.
- No public evidence: peak/mean work (2) and the RAM working-set fraction (0.1). Proposed measurements: the p99 one-minute rate over the monthly mean from customer CloudWatch metrics; the buffer hit ratio while stepping RAM under a fixed YCSB-B load.
- Node bounds: Cloud SQL Enterprise allows 1-96 vCPUs at 0.9-6.5 GB per vCPU and up to 64 TB with a dedicated vCPU (https://docs.cloud.google.com/sql/docs/postgres/instance-settings).
- Stored GiB already includes the origin family’s physical footprint assumptions; no second storage amplification is applied.
- The operations/vCPU coefficient supplies the compute requirement alongside explicit resource-hour minima.
- Copies and allocation fractions change cost only; they do not increase modeled primary capacity.
- AWS Price List API, AmazonKinesisFirehose offer: https://pricing.us-east-1.amazonaws.com/offers/v1.0/aws/AmazonKinesisFirehose/current/us-east-1/index.json
- Azure Retail Prices API: https://prices.azure.com/api/retail/prices
- Additional network transfer, backups, KMS, one-time migration and operational labor unless an explicit meter includes them.
- Destination application execution and separately billed downstream services; supply those allocations separately.
- Dynamic partitioning, format conversion, VPC delivery and origin sink charges; transformation-specific compute.
- Taxes, discounts, credits and free-tier allowances not explicitly listed by this model.
- Unmodeled dependent services, task execution and operations outside the selected workload family.
plan-e70d3da9518fe5f10abaa57aa39c4824d78b4e6e / 2026-10-22.planning.2. Curve: workload-1.
Sources: AWS Price List API, AmazonKinesisFirehose offer, Azure Retail Prices API.
Data Firehose → Azure Event Hubs: Authored native-usage planning example. Native monthly usage priced at the cited provider list prices; listed target allowances apply where present, excluding invoice credits, taxes and negotiated discounts.
Scenario source region: us-east-1. Scenario target region: East US. Currency: USD.
Estimated allocation, not benchmark calibrated: sized at 2 vCPU, 8 GiB memory and 100 GiB SSD for this scenario.
Unestimated components: Adapter hosting, Tensor9 fees. A modeled adapted total and savings require these costs.
Cost scope: Modeled target native service and explicitly modeled state allocation; hosting and Tensor9 fees only when supplied.
Excluded costs and workload features:
- Additional network transfer, backups, KMS, one-time migration and operational labor unless an explicit meter includes them.
- Destination application execution and separately billed downstream services; supply those allocations separately.
- Dynamic partitioning, format conversion, VPC delivery and origin sink charges; transformation-specific compute.
- Taxes, discounts, credits and free-tier allowances not explicitly listed by this model.
- Unmodeled dependent services, task execution and operations outside the selected workload family.
- Translated reads: 0 operations.
- Translated writes: 0 operations.
- Translated resident physical data: 0 GiB-month.
- Native provider operations: 0 operations.
- Published payload: 0 GiB.
- Delivered payload: 0 GiB.
- Allocated execution CPU: 0 vCPU-hour.
- Allocated execution RAM: 0 GiB-hour.
- Independent resource allocation: 0 resource-hour.
- Independent inventory: 0 resource-month.
- Input tokens: 0 tokens.
- Output tokens: 0 tokens.
- Billable network: 0 GiB.
- Dependent object sink retained data: 0 GiB-month.
- Dependent object sink writes: 0 writes.
- Explicit durable staging footprint: 0 GiB-month.
- Rates are cited provider list prices, editable for discounts, commitments or another region. Workload translation and capacity coefficients remain editable planning assumptions, not benchmark measurements or a commercial quote.
- Default-zero rates are explicit assumptions, not evidence that the deployed service or resource is free.
- Provisioned-unit minimums use an editable approximate allocation floor. Modeled target service cost is max(usage/allocation, minimum), with billable network, durable staging and dependent sinks added separately; actual RU/TU sizing, scaling increments and throughput remain unqualified.
- Durable staging is priced once: provisioned targets include adapter state in their selected allocation; native targets add a separate staging allocation when required. Adapter hosting is a separate allocation and must exclude resources already priced as staging, workers or target capacity.
- A declared adapter mapping and cost model do not establish implementation availability or service equivalence.
- This is a declared directed mapping; a planning estimate does not establish deployment or request-serving support.
- Authored planning assumptions, not measured adapter capacity. Origin rates are cited first-tier list prices, before free allowances and discounts.
- A cost scenario does not establish backend availability, protocol fidelity or production readiness. Registry serving status remains independent.
- The landing buffer, durable staging, delivery workers and object sink are separate allocations. Primary stored GiB is retained landing payload; staging adds delivery metadata.
- Object sink retention and PUTs are priced separately from the landing backend. Even an object-store landing target needs the explicitly modeled temporary buffer allocation.
- These retention and sink-write assumptions are provisional; a broker-only subtotal does not price the complete pipeline.
- Azure Event Hubs Standard bills throughput-unit hours, sized here from the family’s published and delivered bytes and its ingress (write) and egress (read) event rates against one unit’s published limits, never below one unit (USD 21.90/month). Ingress events also bill USD 0.028 per million; each family write is one event, and events over 64 KB, which bill as several, are not split. Up to 84 GB of storage per unit is included, so retained data adds no charge. Capture, when enabled, bills USD 0.10 per throughput-unit hour and is not modeled.
- Row-store throughput (capacityOpsPerVcpuSecond, default 1500) is measured-by-tensor9 as a lower bound: the DynamoDB adapter on Cloud SQL db-custom-2-7680 (2 vCPU, PostgreSQL 16, us-west1) served 2,974 ops/s of YCSB-A at 16 threads without recorded saturation (src/main/kotlin/t9/prime/equiv/generated/eval/CloudsqlPostgresqlYcsbAT16GoYcsbV1_0_0.kt). Published CPU-bound pgbench reaches 3,101 read-write transactions and 20,289 point reads per vCPU-second (AWS z1d.2xlarge, PostgreSQL 14.5), so actual capacity is likely higher. Reads and writes share one coefficient: at the same adapter version, read-only YCSB-C was not faster than 50%-update YCSB-A.
- Log-broker throughput (capacityStreamMiBPerVcpuSecond 20 at 0.5 utilization, 4 GiB RAM per vCPU) is provider-documented by Google Managed Service for Apache Kafka sizing (https://docs.cloud.google.com/managed-service-for-apache-kafka/docs/plan-cluster-size): write-equivalent bytes are replicated writes plus a quarter of reads. Producer batches below 10 KB lower per-CPU throughput; that penalty is not modeled.
- Disk utilization 0.8 is provider-documented headroom below Cloud SQL automatic storage increase, which triggers near 91-95% full (https://docs.cloud.google.com/sql/docs/postgres/instance-settings). The 20 GiB reserve exceeds PostgreSQL’s 1 GB default max_wal_size; the remainder of that reserve is unmeasured.
- CPU tiers double from 2 vCPUs to the target’s largest node at 4 GiB per vCPU; each target’s documented largest node bounds CPU, RAM, RAM per vCPU and disk, and the durable staging database uses Cloud SQL Enterprise (96 vCPU, 6.5 GiB per vCPU, 624 GiB, 64 TiB). Targets billed per capacity unit or throughput unit are sized by their backend instead.
- No public evidence: peak/mean work (2) and the RAM working-set fraction (0.1). Proposed measurements: the p99 one-minute rate over the monthly mean from customer CloudWatch metrics; the buffer hit ratio while stepping RAM under a fixed YCSB-B load.
- Node bounds: Cloud SQL Enterprise allows 1-96 vCPUs at 0.9-6.5 GB per vCPU and up to 64 TB with a dedicated vCPU (https://docs.cloud.google.com/sql/docs/postgres/instance-settings).
- Stored GiB already includes the origin family’s physical footprint assumptions; no second storage amplification is applied.
- The operations/vCPU coefficient supplies the compute requirement alongside explicit resource-hour minima.
- Copies and allocation fractions change cost only; they do not increase modeled primary capacity.
plan-e70d3da9518fe5f10abaa57aa39c4824d78b4e6e / 2026-10-22.planning.2. Scenario: planning-example.
Sources: AWS Price List API, AmazonKinesisFirehose offer, Azure Retail Prices API.
On OCI
How it works
Your application keeps sendingPutRecord and PutRecordBatch requests, now to the Tensor9 adapter. The adapter buffers accepted records on OCI Streaming, and a delivery worker sends batches to the destination, OCI Object Storage. A successful call means the records were accepted into the buffer, not that the destination received them. When a batch has both successful and failed records, check each record’s result.
Size and interval settings decide when a batch is ready. A quiet stream may wait for the interval, and a busy one may reach the size first. Worker scheduling, optional transformation and the destination’s response time also add delay, so the buffering interval is not an end-to-end latency guarantee.
Transformation and destinations
The intended delivery path can run a batch through the selected Lambda adapter before it is written. JSON-to-Parquet conversion uses a default or inferred schema, not the declared Glue table schema; check the field types and the resulting files with the tools that read them. HTTP, search and SaaS destinations need their own credentials, reachable endpoints and delivery formats. A warehouse destination delivers records to the selected warehouse; you configure its tables and load format.Limitations
- Glue table schemas for Parquet conversion are not supported. Conversion uses a default or inferred schema. - Moving a Redshift warehouse is not supported. The database, schema, SQL queries and warehouse workload stay where they are. - Retries behave differently: they can repeat records. A destination can accept a batch before the worker records success, so a retry can repeat records or create a duplicate object. Downstream processing should detect duplicates. - Buffered AWS records are not moved. Records still buffered in the old AWS stream are not copied into the new buffer.
Other considerations
Before switching producers. Set up destination storage, credentials and any transformation first, and let the old AWS stream finish delivering its buffered records. Test the destination with representative batches, including failures and retries. What to monitor. Watch pending work, retry failures and destination delivery rather than successfulPutRecord calls. Measure delivery delay and sustained throughput with your actual transform, batch settings and destination.
Example monthly charges
This Tensor9 BYOC scenario estimates service charges for the named origin and target services. Adapter hosting and commercial Tensor9 fees need separate allocations. How Tensor9 estimates costs explains the method and what the estimates include.Data Firehose · Billed ingestion
Feature: Data Firehose. Estimated monthly service charges by Billed ingestion. Adapter hosting and Tensor9 fees are excluded. Source: us-east-1; target: us-ashburn-1 (OCI global price list); currency: USD.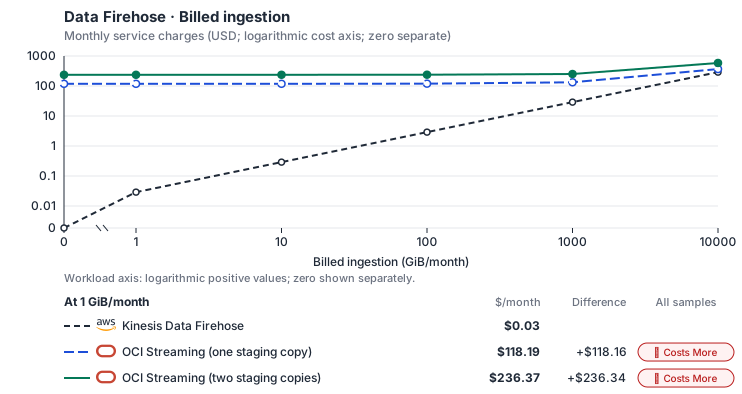
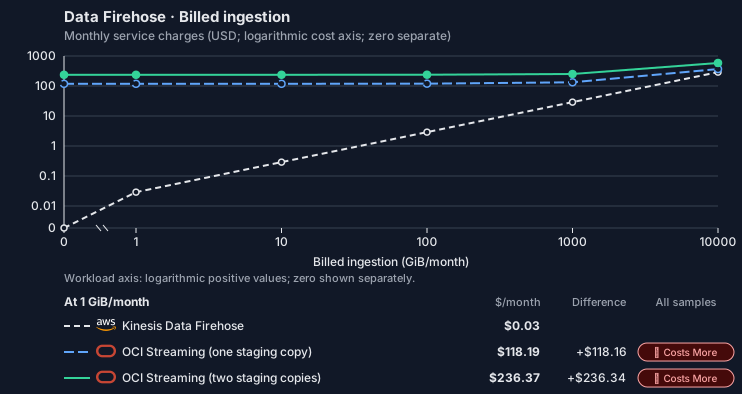
Estimated allocation, not benchmark calibrated: sized from 2 vCPU, 8 GiB memory and 100 GiB SSD at 0 GiB/month to 4 vCPU, 16 GiB memory and 100 GiB SSD at 10,000 GiB/month.
Curve assumptions
- Billed GiB includes per-record rounding; physical bytes can be much lower for small records. Other native meters and workload assumptions retain their explicitly displayed default quantities. Workload translation and capacity assumptions are not benchmark measurements.
- Native monthly usage priced at the cited provider list prices; listed target allowances apply where present, excluding invoice credits, taxes and negotiated discounts. Rates as of 2026-10-22: us-east-1 → us-ashburn-1 (OCI global price list), USD/month.
- Source prices are reference charges, not an invoice. Target lines cover selected service usage/configuration only; adapter hosting and Tensor9 fees are excluded.
- Samples of explicit prices are not performance measurements or capacity qualification. No interpolation or break-even guarantee is implied.
- Variant assumptions show the first axis sample; any axis-dependent configuration is described by this curve’s workload note.
- Rates are cited provider list prices, editable for discounts, commitments or another region. Workload translation and capacity coefficients remain editable planning assumptions, not benchmark measurements or a commercial quote.
- Default-zero rates are explicit assumptions, not evidence that the deployed service or resource is free.
- Provisioned-unit minimums use an editable approximate allocation floor. Modeled target service cost is max(usage/allocation, minimum), with billable network, durable staging and dependent sinks added separately; actual RU/TU sizing, scaling increments and throughput remain unqualified.
- Durable staging is priced once: provisioned targets include adapter state in their selected allocation; native targets add a separate staging allocation when required. Adapter hosting is a separate allocation and must exclude resources already priced as staging, workers or target capacity.
- A declared adapter mapping and cost model do not establish implementation availability or service equivalence.
- This is a declared directed mapping; a planning estimate does not establish deployment or request-serving support.
- Authored planning assumptions, not measured adapter capacity. Origin rates are cited first-tier list prices, before free allowances and discounts.
- A cost scenario does not establish backend availability, protocol fidelity or production readiness. Registry serving status remains independent.
- The landing buffer, durable staging, delivery workers and object sink are separate allocations. Primary stored GiB is retained landing payload; staging adds delivery metadata.
- Object sink retention and PUTs are priced separately from the landing backend. Even an object-store landing target needs the explicitly modeled temporary buffer allocation.
- These retention and sink-write assumptions are provisional; a broker-only subtotal does not price the complete pipeline.
- OCI Streaming bills PUT and GET bytes and retained GB-hours, with no partition charge within the default service limits; beyond them OCI expects at least 10 GB/hour of PUT and GET per 50 partitions. Retention defaults to 24 hours, up to 7 days.
- Row-store throughput (capacityOpsPerVcpuSecond, default 1500) is measured-by-tensor9 as a lower bound: the DynamoDB adapter on Cloud SQL db-custom-2-7680 (2 vCPU, PostgreSQL 16, us-west1) served 2,974 ops/s of YCSB-A at 16 threads without recorded saturation (src/main/kotlin/t9/prime/equiv/generated/eval/CloudsqlPostgresqlYcsbAT16GoYcsbV1_0_0.kt). Published CPU-bound pgbench reaches 3,101 read-write transactions and 20,289 point reads per vCPU-second (AWS z1d.2xlarge, PostgreSQL 14.5), so actual capacity is likely higher. Reads and writes share one coefficient: at the same adapter version, read-only YCSB-C was not faster than 50%-update YCSB-A.
- Log-broker throughput (capacityStreamMiBPerVcpuSecond 20 at 0.5 utilization, 4 GiB RAM per vCPU) is provider-documented by Google Managed Service for Apache Kafka sizing (https://docs.cloud.google.com/managed-service-for-apache-kafka/docs/plan-cluster-size): write-equivalent bytes are replicated writes plus a quarter of reads. Producer batches below 10 KB lower per-CPU throughput; that penalty is not modeled.
- Disk utilization 0.8 is provider-documented headroom below Cloud SQL automatic storage increase, which triggers near 91-95% full (https://docs.cloud.google.com/sql/docs/postgres/instance-settings). The 20 GiB reserve exceeds PostgreSQL’s 1 GB default max_wal_size; the remainder of that reserve is unmeasured.
- CPU tiers double from 2 vCPUs to the target’s largest node at 4 GiB per vCPU; each target’s documented largest node bounds CPU, RAM, RAM per vCPU and disk, and the durable staging database uses Cloud SQL Enterprise (96 vCPU, 6.5 GiB per vCPU, 624 GiB, 64 TiB). Targets billed per capacity unit or throughput unit are sized by their backend instead.
- No public evidence: peak/mean work (2) and the RAM working-set fraction (0.1). Proposed measurements: the p99 one-minute rate over the monthly mean from customer CloudWatch metrics; the buffer hit ratio while stepping RAM under a fixed YCSB-B load.
- Node bounds: Cloud SQL Enterprise allows 1-96 vCPUs at 0.9-6.5 GB per vCPU and up to 64 TB with a dedicated vCPU (https://docs.cloud.google.com/sql/docs/postgres/instance-settings).
- Stored GiB already includes the origin family’s physical footprint assumptions; no second storage amplification is applied.
- The operations/vCPU coefficient supplies the compute requirement alongside explicit resource-hour minima.
- Copies and allocation fractions change cost only; they do not increase modeled primary capacity.
- AWS Price List API, AmazonKinesisFirehose offer: https://pricing.us-east-1.amazonaws.com/offers/v1.0/aws/AmazonKinesisFirehose/current/us-east-1/index.json
- OCI price list API: https://apexapps.oracle.com/pls/apex/cetools/api/v1/products/
- Additional network transfer, backups, KMS, one-time migration and operational labor unless an explicit meter includes them.
- Destination application execution and separately billed downstream services; supply those allocations separately.
- Dynamic partitioning, format conversion, VPC delivery and origin sink charges; transformation-specific compute.
- Taxes, discounts, credits and free-tier allowances not explicitly listed by this model.
- Unmodeled dependent services, task execution and operations outside the selected workload family.
plan-58fa05b1b7165c11f9ab9ab5b17c9cfc69e313e3 / 2026-10-22.planning.2. Curve: workload-1.
Sources: AWS Price List API, AmazonKinesisFirehose offer, OCI price list API.
Data Firehose → OCI Streaming: Authored native-usage planning example. Native monthly usage priced at the cited provider list prices; listed target allowances apply where present, excluding invoice credits, taxes and negotiated discounts.
Scenario source region: us-east-1. Scenario target region: us-ashburn-1 (OCI global price list). Currency: USD.
Estimated allocation, not benchmark calibrated: sized at 2 vCPU, 8 GiB memory and 100 GiB SSD for this scenario.
Unestimated components: Adapter hosting, Tensor9 fees. A modeled adapted total and savings require these costs.
Cost scope: Modeled target native service and explicitly modeled state allocation; hosting and Tensor9 fees only when supplied.
Excluded costs and workload features:
- Additional network transfer, backups, KMS, one-time migration and operational labor unless an explicit meter includes them.
- Destination application execution and separately billed downstream services; supply those allocations separately.
- Dynamic partitioning, format conversion, VPC delivery and origin sink charges; transformation-specific compute.
- Taxes, discounts, credits and free-tier allowances not explicitly listed by this model.
- Unmodeled dependent services, task execution and operations outside the selected workload family.
- Translated reads: 0 operations.
- Translated writes: 0 operations.
- Translated resident physical data: 0 GiB-month.
- Native provider operations: 0 operations.
- Published payload: 0 GiB.
- Delivered payload: 0 GiB.
- Allocated execution CPU: 0 vCPU-hour.
- Allocated execution RAM: 0 GiB-hour.
- Independent resource allocation: 0 resource-hour.
- Independent inventory: 0 resource-month.
- Input tokens: 0 tokens.
- Output tokens: 0 tokens.
- Billable network: 0 GiB.
- Dependent object sink retained data: 0 GiB-month.
- Dependent object sink writes: 0 writes.
- Explicit durable staging footprint: 0 GiB-month.
- Rates are cited provider list prices, editable for discounts, commitments or another region. Workload translation and capacity coefficients remain editable planning assumptions, not benchmark measurements or a commercial quote.
- Default-zero rates are explicit assumptions, not evidence that the deployed service or resource is free.
- Provisioned-unit minimums use an editable approximate allocation floor. Modeled target service cost is max(usage/allocation, minimum), with billable network, durable staging and dependent sinks added separately; actual RU/TU sizing, scaling increments and throughput remain unqualified.
- Durable staging is priced once: provisioned targets include adapter state in their selected allocation; native targets add a separate staging allocation when required. Adapter hosting is a separate allocation and must exclude resources already priced as staging, workers or target capacity.
- A declared adapter mapping and cost model do not establish implementation availability or service equivalence.
- This is a declared directed mapping; a planning estimate does not establish deployment or request-serving support.
- Authored planning assumptions, not measured adapter capacity. Origin rates are cited first-tier list prices, before free allowances and discounts.
- A cost scenario does not establish backend availability, protocol fidelity or production readiness. Registry serving status remains independent.
- The landing buffer, durable staging, delivery workers and object sink are separate allocations. Primary stored GiB is retained landing payload; staging adds delivery metadata.
- Object sink retention and PUTs are priced separately from the landing backend. Even an object-store landing target needs the explicitly modeled temporary buffer allocation.
- These retention and sink-write assumptions are provisional; a broker-only subtotal does not price the complete pipeline.
- OCI Streaming bills PUT and GET bytes and retained GB-hours, with no partition charge within the default service limits; beyond them OCI expects at least 10 GB/hour of PUT and GET per 50 partitions. Retention defaults to 24 hours, up to 7 days.
- Row-store throughput (capacityOpsPerVcpuSecond, default 1500) is measured-by-tensor9 as a lower bound: the DynamoDB adapter on Cloud SQL db-custom-2-7680 (2 vCPU, PostgreSQL 16, us-west1) served 2,974 ops/s of YCSB-A at 16 threads without recorded saturation (src/main/kotlin/t9/prime/equiv/generated/eval/CloudsqlPostgresqlYcsbAT16GoYcsbV1_0_0.kt). Published CPU-bound pgbench reaches 3,101 read-write transactions and 20,289 point reads per vCPU-second (AWS z1d.2xlarge, PostgreSQL 14.5), so actual capacity is likely higher. Reads and writes share one coefficient: at the same adapter version, read-only YCSB-C was not faster than 50%-update YCSB-A.
- Log-broker throughput (capacityStreamMiBPerVcpuSecond 20 at 0.5 utilization, 4 GiB RAM per vCPU) is provider-documented by Google Managed Service for Apache Kafka sizing (https://docs.cloud.google.com/managed-service-for-apache-kafka/docs/plan-cluster-size): write-equivalent bytes are replicated writes plus a quarter of reads. Producer batches below 10 KB lower per-CPU throughput; that penalty is not modeled.
- Disk utilization 0.8 is provider-documented headroom below Cloud SQL automatic storage increase, which triggers near 91-95% full (https://docs.cloud.google.com/sql/docs/postgres/instance-settings). The 20 GiB reserve exceeds PostgreSQL’s 1 GB default max_wal_size; the remainder of that reserve is unmeasured.
- CPU tiers double from 2 vCPUs to the target’s largest node at 4 GiB per vCPU; each target’s documented largest node bounds CPU, RAM, RAM per vCPU and disk, and the durable staging database uses Cloud SQL Enterprise (96 vCPU, 6.5 GiB per vCPU, 624 GiB, 64 TiB). Targets billed per capacity unit or throughput unit are sized by their backend instead.
- No public evidence: peak/mean work (2) and the RAM working-set fraction (0.1). Proposed measurements: the p99 one-minute rate over the monthly mean from customer CloudWatch metrics; the buffer hit ratio while stepping RAM under a fixed YCSB-B load.
- Node bounds: Cloud SQL Enterprise allows 1-96 vCPUs at 0.9-6.5 GB per vCPU and up to 64 TB with a dedicated vCPU (https://docs.cloud.google.com/sql/docs/postgres/instance-settings).
- Stored GiB already includes the origin family’s physical footprint assumptions; no second storage amplification is applied.
- The operations/vCPU coefficient supplies the compute requirement alongside explicit resource-hour minima.
- Copies and allocation fractions change cost only; they do not increase modeled primary capacity.
plan-58fa05b1b7165c11f9ab9ab5b17c9cfc69e313e3 / 2026-10-22.planning.2. Scenario: planning-example.
Sources: AWS Price List API, AmazonKinesisFirehose offer, OCI price list API.
Costs
Estimated monthly service charges for each backend with a published cost model, at one sampled workload from that model’s cost curve. Adapter hosting and Tensor9 fees are excluded. How Tensor9 estimates costs explains the method, what the estimates include and how to read their qualifications.
Difference means backend minus origin; a positive difference means the backend costs more. Workloads and target configurations differ by model, so compare each row’s difference at its stated workload rather than charges across rows.
Cost curves across workload sizes, with every assumption and exclusion: Amazon Kinesis costs.
Service level agreements
Listed terms cover requests sent through this service adapter. They do not cover direct connections to the target service or replace the cloud provider’s own SLA. Each origin-to-target pair has its own terms or an explicit pending status. See the SLA tables, measurement rules, and scaling conditions.Kinesis Data Firehose to Azure Event Hubs
Adapter-added latency. A + prefix marks time added by the adapter, not the total time your application waits. Total request time includes adapter processing, backend service time and network time. The backend provider’s SLA applies independently. Only separately measured target-service wait may be subtracted, and only when your agreement permits it; internal metadata, coordination and retry processing still count. For one request, 12 ms of adapter processing plus 90 ms waiting for the backend means at least 102 ms total. This example does not add monthly p99 values.
What Tensor9 covers. These service levels cover the adapter between the origin API and target API. They do not replace the target provider’s SLA.
How latency is counted. Adapter work, including metadata and coordination, counts. Only separately measured permitted target waits are excluded.
Which terms apply. Your signed agreement names the covered operations, workload limits, remedies, and final service levels for your deployment.
What this adapter does
Forazure::1.0.0::eventhubs, Event Hubs accepts the buffered records; partition capacity and producer quotas limit native ingestion. The adapter’s ingest response and the delivery agent’s sink write are distinct. Buffer size and interval control when accepted records are flushed. A Lambda transform or format conversion adds a later processing stage; the PutRecord target must not be read as a deadline for completing that pipeline.
How the latency targets were chosen
Small delivery-record acceptance: +3 ms monthly p99 (adapter-added).PutRecord. JSON/base64 decoding, stream selection, bounded record construction and response encoding. Adapter-owned configuration and acceptance bookkeeping remain included.
Bounded delivery-record batch acceptance: +10 ms monthly p99 (adapter-added). PutRecordBatch. Decode each record, construct bounded native batch requests and assemble partial results. The bound covers records as well as bytes.
Delivery-stream configuration responses: +20 ms monthly p99 (adapter-added). CreateDeliveryStream, DeleteDeliveryStream. Persist stream identity and delivery settings before acknowledging the configuration request; adapter catalog and coordination storage waits count.
Your signed agreement sets the terms for your deployment. A target does not add an operation or option that the compatibility tables mark unavailable.
What counts toward latency
For a request-response row, measure from the agreed ingress boundary to dispatch of the complete response. A row that explicitly names a first response chunk ends at that chunk; its number does not cover the rest of the stream. A long-poll row names the intentional wait and when adapter delay starts. Include parsing, authorization, admission, translation, serialization, adapter-owned storage and coordination, retries and response handling. Subtract only separately measured target-workload waits and external network segments allowed by the measurement rules. The adapter’s own response handling and dispatch remain covered. A database used for adapter metadata is still adapter work, even if a cloud provider hosts it. For concurrent calls, exclude the union of permitted wait intervals, not the sum of overlapping spans. Calculate each request’s adapter duration first, then the monthly p99. Do not subtract one service’s p99 from another’s. Known adapter timeouts are over-budget samples; failed or incomplete requests cannot disappear to improve the percentile. Missing measurements do not become zero latency. An SDK call span alone does not prove how much of its duration can be excluded.Endpoint reachability and request failures
The endpoint-reachability target measures adapter health checks. Correctly forwarding a target quota or permission error is different from producing that error because the adapter sent the wrong request. Adapter-caused failures remain Tensor9’s responsibility even when the target is healthy. Correctness and data-integrity requirements apply to every supported request. Endpoint reachability does not measure request correctness or grant an allowance for incorrect results.Scaling and target-service capacity
Scale record ingestion separately from buffering and destination delivery. Track records and bytes per second, active streams, buffer occupancy and oldest undelivered record, plus target partition capacity and consumer lag. A small ingest response does not prove that delivery keeps up. The agreement bounds batch size, active streams, transformation work and burst accumulation. Tensor9 scales adapter workers within that envelope; the customer supplies sufficient native landing-store and sink capacity. Tell Tensor9 the expected steady rate, bursts, concurrency, payload sizes and operation mix. Tensor9 sizes and scales the adapter for the agreed load; you choose and monitor the target service’s capacity with Tensor9’s help. A latency budget is not a requests-per-second rating. Larger requests and higher rates need explicit terms, not silent inheritance of a small-request SLA.Data and behavior guarantees
A successful ingest result must correspond to the documented durable acceptance point, and batches retain individual record failures. Retried sink writes may duplicate data; a delivery acknowledgement must not cause accepted records to be discarded before the supported sink commit. Destination-specific format conversion, transformations, partitioning and error handling remain limited by the profile. The standard ingest SLA does not promise exactly-once sink effects or zero delivery lag.Example and diagnosis
For delivery streamapplication-audit, submit 80 records of 2 KiB each. This fits the batch-acceptance row. If the configured delivery interval is 60 seconds, a record waiting inside that intended buffer has not breached the 10 ms ingest target. A growing backlog after successive flushes requires inspecting delivery workers, transformation errors and target sink capacity; request translation timing alone does not explain it.
Use tensor9 explain and the documented explain headers to understand the selected adapter and its behavior. Correlate available request diagnostics with the target provider’s latency, throttling and capacity metrics. An explain report helps diagnose a request; it is not by itself a qualified SLA timing measurement. Share the operation, request shape, timestamps and request identifiers with support, with credentials and customer payloads removed.
Kinesis Data Firehose to Pub/Sub
Adapter-added latency. A + prefix marks time added by the adapter, not the total time your application waits. Total request time includes adapter processing, backend service time and network time. The backend provider’s SLA applies independently. Only separately measured target-service wait may be subtracted, and only when your agreement permits it; internal metadata, coordination and retry processing still count. For one request, 12 ms of adapter processing plus 90 ms waiting for the backend means at least 102 ms total. This example does not add monthly p99 values.
What Tensor9 covers. These service levels cover the adapter between the origin API and target API. They do not replace the target provider’s SLA.
How latency is counted. Adapter work, including metadata and coordination, counts. Only separately measured permitted target waits are excluded.
Which terms apply. Your signed agreement names the covered operations, workload limits, remedies, and final service levels for your deployment.
What this adapter does
Forgoogle::1.0.0::pubsub, Pub/Sub accepts buffered records; publication, subscription backlog and acknowledgement are separate stages. The adapter’s ingest response and the delivery agent’s sink write are distinct. Buffer size and interval control when accepted records are flushed. A Lambda transform or format conversion adds a later processing stage; the PutRecord target must not be read as a deadline for completing that pipeline.
How the latency targets were chosen
Small delivery-record acceptance: +3 ms monthly p99 (adapter-added).PutRecord. JSON/base64 decoding, stream selection, bounded record construction and response encoding. Adapter-owned configuration and acceptance bookkeeping remain included.
Bounded delivery-record batch acceptance: +10 ms monthly p99 (adapter-added). PutRecordBatch. Decode each record, construct bounded native batch requests and assemble partial results. The bound covers records as well as bytes.
Delivery-stream configuration responses: +20 ms monthly p99 (adapter-added). CreateDeliveryStream, DeleteDeliveryStream. Persist stream identity and delivery settings before acknowledging the configuration request; adapter catalog and coordination storage waits count.
Your signed agreement sets the terms for your deployment. A target does not add an operation or option that the compatibility tables mark unavailable.
What counts toward latency
For a request-response row, measure from the agreed ingress boundary to dispatch of the complete response. A row that explicitly names a first response chunk ends at that chunk; its number does not cover the rest of the stream. A long-poll row names the intentional wait and when adapter delay starts. Include parsing, authorization, admission, translation, serialization, adapter-owned storage and coordination, retries and response handling. Subtract only separately measured target-workload waits and external network segments allowed by the measurement rules. The adapter’s own response handling and dispatch remain covered. A database used for adapter metadata is still adapter work, even if a cloud provider hosts it. For concurrent calls, exclude the union of permitted wait intervals, not the sum of overlapping spans. Calculate each request’s adapter duration first, then the monthly p99. Do not subtract one service’s p99 from another’s. Known adapter timeouts are over-budget samples; failed or incomplete requests cannot disappear to improve the percentile. Missing measurements do not become zero latency. An SDK call span alone does not prove how much of its duration can be excluded.Endpoint reachability and request failures
The endpoint-reachability target measures adapter health checks. Correctly forwarding a target quota or permission error is different from producing that error because the adapter sent the wrong request. Adapter-caused failures remain Tensor9’s responsibility even when the target is healthy. Correctness and data-integrity requirements apply to every supported request. Endpoint reachability does not measure request correctness or grant an allowance for incorrect results.Scaling and target-service capacity
Scale record ingestion separately from buffering and destination delivery. Track records and bytes per second, active streams, buffer occupancy and oldest undelivered record, plus target partition capacity and consumer lag. A small ingest response does not prove that delivery keeps up. The agreement bounds batch size, active streams, transformation work and burst accumulation. Tensor9 scales adapter workers within that envelope; the customer supplies sufficient native landing-store and sink capacity. Tell Tensor9 the expected steady rate, bursts, concurrency, payload sizes and operation mix. Tensor9 sizes and scales the adapter for the agreed load; you choose and monitor the target service’s capacity with Tensor9’s help. A latency budget is not a requests-per-second rating. Larger requests and higher rates need explicit terms, not silent inheritance of a small-request SLA.Data and behavior guarantees
A successful ingest result must correspond to the documented durable acceptance point, and batches retain individual record failures. Retried sink writes may duplicate data; a delivery acknowledgement must not cause accepted records to be discarded before the supported sink commit. Destination-specific format conversion, transformations, partitioning and error handling remain limited by the profile. The standard ingest SLA does not promise exactly-once sink effects or zero delivery lag.Example and diagnosis
For delivery streamapplication-audit, submit 80 records of 2 KiB each. This fits the batch-acceptance row. If the configured delivery interval is 60 seconds, a record waiting inside that intended buffer has not breached the 10 ms ingest target. A growing backlog after successive flushes requires inspecting delivery workers, transformation errors and target sink capacity; request translation timing alone does not explain it.
Use tensor9 explain and the documented explain headers to understand the selected adapter and its behavior. Correlate available request diagnostics with the target provider’s latency, throttling and capacity metrics. An explain report helps diagnose a request; it is not by itself a qualified SLA timing measurement. Share the operation, request shape, timestamps and request identifiers with support, with credentials and customer payloads removed.
Kinesis Data Firehose to OCI Streaming
Adapter-added latency. A + prefix marks time added by the adapter, not the total time your application waits. Total request time includes adapter processing, backend service time and network time. The backend provider’s SLA applies independently. Only separately measured target-service wait may be subtracted, and only when your agreement permits it; internal metadata, coordination and retry processing still count. For one request, 12 ms of adapter processing plus 90 ms waiting for the backend means at least 102 ms total. This example does not add monthly p99 values.
What Tensor9 covers. These service levels cover the adapter between the origin API and target API. They do not replace the target provider’s SLA.
How latency is counted. Adapter work, including metadata and coordination, counts. Only separately measured permitted target waits are excluded.
Which terms apply. Your signed agreement names the covered operations, workload limits, remedies, and final service levels for your deployment.
What this adapter does
Foroci::1.0.0::streaming, OCI Streaming accepts the buffered records; partition limits and retained positions constrain ingestion and replay. The adapter’s ingest response and the delivery agent’s sink write are distinct. Buffer size and interval control when accepted records are flushed. A Lambda transform or format conversion adds a later processing stage; the PutRecord target must not be read as a deadline for completing that pipeline.
How the latency targets were chosen
Small delivery-record acceptance: +3 ms monthly p99 (adapter-added).PutRecord. JSON/base64 decoding, stream selection, bounded record construction and response encoding. Adapter-owned configuration and acceptance bookkeeping remain included.
Bounded delivery-record batch acceptance: +10 ms monthly p99 (adapter-added). PutRecordBatch. Decode each record, construct bounded native batch requests and assemble partial results. The bound covers records as well as bytes.
Delivery-stream configuration responses: +20 ms monthly p99 (adapter-added). CreateDeliveryStream, DeleteDeliveryStream. Persist stream identity and delivery settings before acknowledging the configuration request; adapter catalog and coordination storage waits count.
Your signed agreement sets the terms for your deployment. A target does not add an operation or option that the compatibility tables mark unavailable.
What counts toward latency
For a request-response row, measure from the agreed ingress boundary to dispatch of the complete response. A row that explicitly names a first response chunk ends at that chunk; its number does not cover the rest of the stream. A long-poll row names the intentional wait and when adapter delay starts. Include parsing, authorization, admission, translation, serialization, adapter-owned storage and coordination, retries and response handling. Subtract only separately measured target-workload waits and external network segments allowed by the measurement rules. The adapter’s own response handling and dispatch remain covered. A database used for adapter metadata is still adapter work, even if a cloud provider hosts it. For concurrent calls, exclude the union of permitted wait intervals, not the sum of overlapping spans. Calculate each request’s adapter duration first, then the monthly p99. Do not subtract one service’s p99 from another’s. Known adapter timeouts are over-budget samples; failed or incomplete requests cannot disappear to improve the percentile. Missing measurements do not become zero latency. An SDK call span alone does not prove how much of its duration can be excluded.Endpoint reachability and request failures
The endpoint-reachability target measures adapter health checks. Correctly forwarding a target quota or permission error is different from producing that error because the adapter sent the wrong request. Adapter-caused failures remain Tensor9’s responsibility even when the target is healthy. Correctness and data-integrity requirements apply to every supported request. Endpoint reachability does not measure request correctness or grant an allowance for incorrect results.Scaling and target-service capacity
Scale record ingestion separately from buffering and destination delivery. Track records and bytes per second, active streams, buffer occupancy and oldest undelivered record, plus target partition capacity and consumer lag. A small ingest response does not prove that delivery keeps up. The agreement bounds batch size, active streams, transformation work and burst accumulation. Tensor9 scales adapter workers within that envelope; the customer supplies sufficient native landing-store and sink capacity. Tell Tensor9 the expected steady rate, bursts, concurrency, payload sizes and operation mix. Tensor9 sizes and scales the adapter for the agreed load; you choose and monitor the target service’s capacity with Tensor9’s help. A latency budget is not a requests-per-second rating. Larger requests and higher rates need explicit terms, not silent inheritance of a small-request SLA.Data and behavior guarantees
A successful ingest result must correspond to the documented durable acceptance point, and batches retain individual record failures. Retried sink writes may duplicate data; a delivery acknowledgement must not cause accepted records to be discarded before the supported sink commit. Destination-specific format conversion, transformations, partitioning and error handling remain limited by the profile. The standard ingest SLA does not promise exactly-once sink effects or zero delivery lag.Example and diagnosis
For delivery streamapplication-audit, submit 80 records of 2 KiB each. This fits the batch-acceptance row. If the configured delivery interval is 60 seconds, a record waiting inside that intended buffer has not breached the 10 ms ingest target. A growing backlog after successive flushes requires inspecting delivery workers, transformation errors and target sink capacity; request translation timing alone does not explain it.
Use tensor9 explain and the documented explain headers to understand the selected adapter and its behavior. Correlate available request diagnostics with the target provider’s latency, throttling and capacity metrics. An explain report helps diagnose a request; it is not by itself a qualified SLA timing measurement. Share the operation, request shape, timestamps and request identifiers with support, with credentials and customer payloads removed.
Kinesis Data Firehose to Strimzi Kafka
Adapter-added latency. A + prefix marks time added by the adapter, not the total time your application waits. Total request time includes adapter processing, backend service time and network time. The backend provider’s SLA applies independently. Only separately measured target-service wait may be subtracted, and only when your agreement permits it; internal metadata, coordination and retry processing still count. For one request, 12 ms of adapter processing plus 90 ms waiting for the backend means at least 102 ms total. This example does not add monthly p99 values.
What Tensor9 covers. These service levels cover the adapter between the origin API and target API. They do not replace the target provider’s SLA.
How latency is counted. Adapter work, including metadata and coordination, counts. Only separately measured permitted target waits are excluded.
Which terms apply. Your signed agreement names the covered operations, workload limits, remedies, and final service levels for your deployment.
What this adapter does
Forstrimzi::1.0.0::kafka, Kafka stores buffered records; topic partitions, producer acknowledgements and delivery-worker consumer positions determine the landing-store behavior. The adapter’s ingest response and the delivery agent’s sink write are distinct. Buffer size and interval control when accepted records are flushed. A Lambda transform or format conversion adds a later processing stage; the PutRecord target must not be read as a deadline for completing that pipeline.
How the latency targets were chosen
Small delivery-record acceptance: +3 ms monthly p99 (adapter-added).PutRecord. JSON/base64 decoding, stream selection, bounded record construction and response encoding. Adapter-owned configuration and acceptance bookkeeping remain included.
Bounded delivery-record batch acceptance: +10 ms monthly p99 (adapter-added). PutRecordBatch. Decode each record, construct bounded native batch requests and assemble partial results. The bound covers records as well as bytes.
Delivery-stream configuration responses: +20 ms monthly p99 (adapter-added). CreateDeliveryStream, DeleteDeliveryStream. Persist stream identity and delivery settings before acknowledging the configuration request; adapter catalog and coordination storage waits count.
Your signed agreement sets the terms for your deployment. A target does not add an operation or option that the compatibility tables mark unavailable.
What counts toward latency
For a request-response row, measure from the agreed ingress boundary to dispatch of the complete response. A row that explicitly names a first response chunk ends at that chunk; its number does not cover the rest of the stream. A long-poll row names the intentional wait and when adapter delay starts. Include parsing, authorization, admission, translation, serialization, adapter-owned storage and coordination, retries and response handling. Subtract only separately measured target-workload waits and external network segments allowed by the measurement rules. The adapter’s own response handling and dispatch remain covered. A database used for adapter metadata is still adapter work, even if a cloud provider hosts it. For concurrent calls, exclude the union of permitted wait intervals, not the sum of overlapping spans. Calculate each request’s adapter duration first, then the monthly p99. Do not subtract one service’s p99 from another’s. Known adapter timeouts are over-budget samples; failed or incomplete requests cannot disappear to improve the percentile. Missing measurements do not become zero latency. An SDK call span alone does not prove how much of its duration can be excluded.Endpoint reachability and request failures
The endpoint-reachability target measures adapter health checks. Correctly forwarding a target quota or permission error is different from producing that error because the adapter sent the wrong request. Adapter-caused failures remain Tensor9’s responsibility even when the target is healthy. Correctness and data-integrity requirements apply to every supported request. Endpoint reachability does not measure request correctness or grant an allowance for incorrect results.Scaling and target-service capacity
Scale record ingestion separately from buffering and destination delivery. Track records and bytes per second, active streams, buffer occupancy and oldest undelivered record, plus target partition capacity and consumer lag. A small ingest response does not prove that delivery keeps up. The agreement bounds batch size, active streams, transformation work and burst accumulation. Tensor9 scales adapter workers within that envelope; the customer supplies sufficient native landing-store and sink capacity. Tell Tensor9 the expected steady rate, bursts, concurrency, payload sizes and operation mix. Tensor9 sizes and scales the adapter for the agreed load; you choose and monitor the target service’s capacity with Tensor9’s help. A latency budget is not a requests-per-second rating. Larger requests and higher rates need explicit terms, not silent inheritance of a small-request SLA.Data and behavior guarantees
A successful ingest result must correspond to the documented durable acceptance point, and batches retain individual record failures. Retried sink writes may duplicate data; a delivery acknowledgement must not cause accepted records to be discarded before the supported sink commit. Destination-specific format conversion, transformations, partitioning and error handling remain limited by the profile. The standard ingest SLA does not promise exactly-once sink effects or zero delivery lag.Example and diagnosis
For delivery streamapplication-audit, submit 80 records of 2 KiB each. This fits the batch-acceptance row. If the configured delivery interval is 60 seconds, a record waiting inside that intended buffer has not breached the 10 ms ingest target. A growing backlog after successive flushes requires inspecting delivery workers, transformation errors and target sink capacity; request translation timing alone does not explain it.
Use tensor9 explain and the documented explain headers to understand the selected adapter and its behavior. Correlate available request diagnostics with the target provider’s latency, throttling and capacity metrics. An explain report helps diagnose a request; it is not by itself a qualified SLA timing measurement. Share the operation, request shape, timestamps and request identifiers with support, with credentials and customer payloads removed.